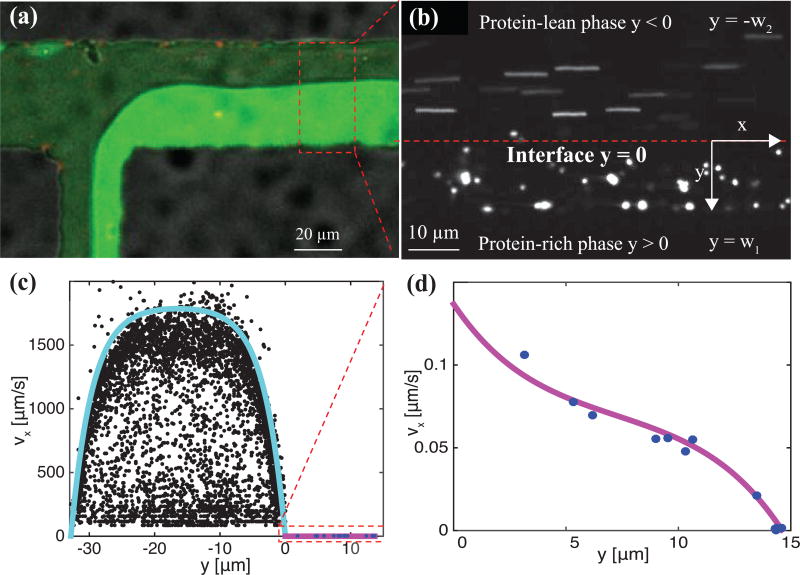
figure 4.
red peg-passivated probe particles are used to quantify velocity profiles in the protein-rich (green) and protein-lean (black) phase. (a) velocity profiles are quantified far from the t-junction (i.e., red dashed box) where the protein-rich/protein-lean interface is mostly flat. (b) to quantify velocity profiles in the protein-lean phase, the length of probe particle streaks and corresponding exposure times are used. velocity profiles in the protein-rich phase are determined by microparticle tracking velocimetry. the red-dashed line denotes the protein-rich/protein-lean interface and particle streaks and single particles are seen in the protein-lean and protein-rich phases, respectively. (c) measured velocity profiles in the protein-lean (filled black circles) and protein-rich (filled blue circles) phase. (d) zoomed in view of protein-rich (filled blue circles) phase. lines are drawn using Eqs. (1) and (2) with β = −0.15 pa/m and μ1= 26.8 pa.s.

