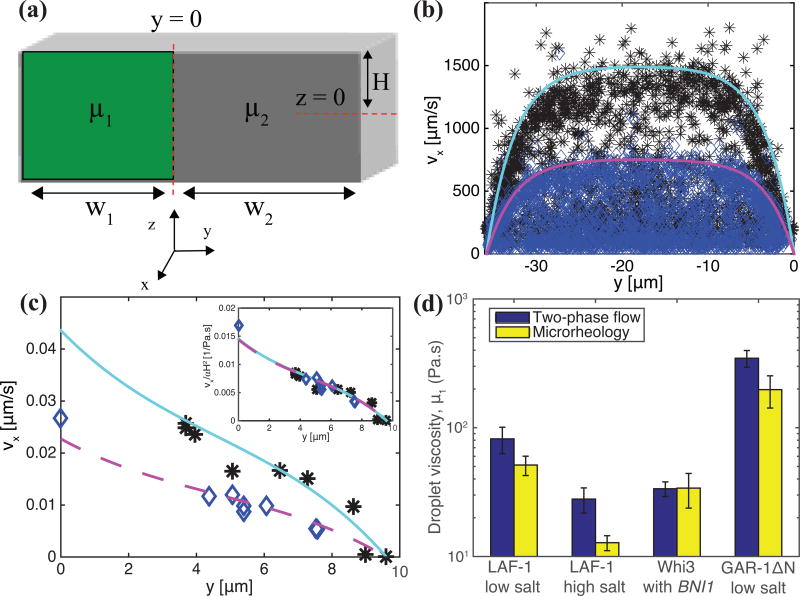
figure 5.
(a) model symbols and geometry. measured velocity profiles in the (b) protein-lean phase and (c) protein-rich phase at high (black asterisks) and low (blue diamonds) shear rates. cyan and magenta lines are drawn using Eqs. (1) and (2) with β = −0.12 pa/m and μ1 = 65 pa.s and β = −0.06 pa/m and μ1 = 63 pa.s, respectively. (d) protein-rich phase viscosity, μ1, for each protein investigated measured using microrheology (yellow bars) and two-phase flow analysis (blue bars). typical error bars are shown and represent standard deviation of at least three replicates.

