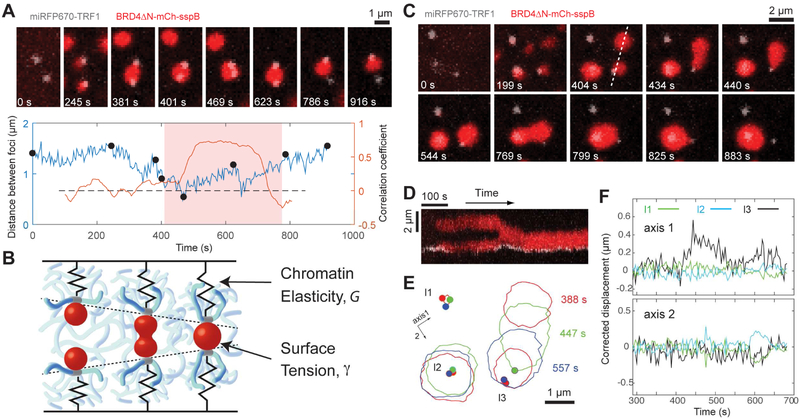
Figure 6.
CasDrop condensates can pull two or more targeted genomic loci together.
(A) (Top) Time lapse images of the NIH3T3 cell expressing dCas9-ST, scFv-sfGFP-iLID, BRD4ΔN-mCh-sspB, miRFP670-TRF1 and telomere-targeting sgRNA during blue light activation. Only a small area around two telomere loci is shown. (Bottom) The distance between two telomere loci is tracked over time. Black dots represent time points when cell images above are taken. The correlation coefficient, computed with a sliding window of 60 frames (= 196 s), is also shown with y axis on the right (Figure S6C). The period shaded in light red represents the time during which two loci are tethered by a single droplet (Figure S6D).
(B) Schematic of genomic loci displacement resulting from coalescence of two associated protein droplets. Red, protein droplets; blue, chromatin network; gray, genomic loci associated with droplets.
(C) Time lapse images similar to (A).
(D) Kymograph along a dashed line in (C) for a time period from 134 s to 763 s.
(E) BRD4 droplet boundaries (solid line) and telomeres (dot) are shown for three time points.
(F) Along two axes shown in (E), corrected displacements (Figure S6E) are plotted for three telomere loci.
See also Figure S6

