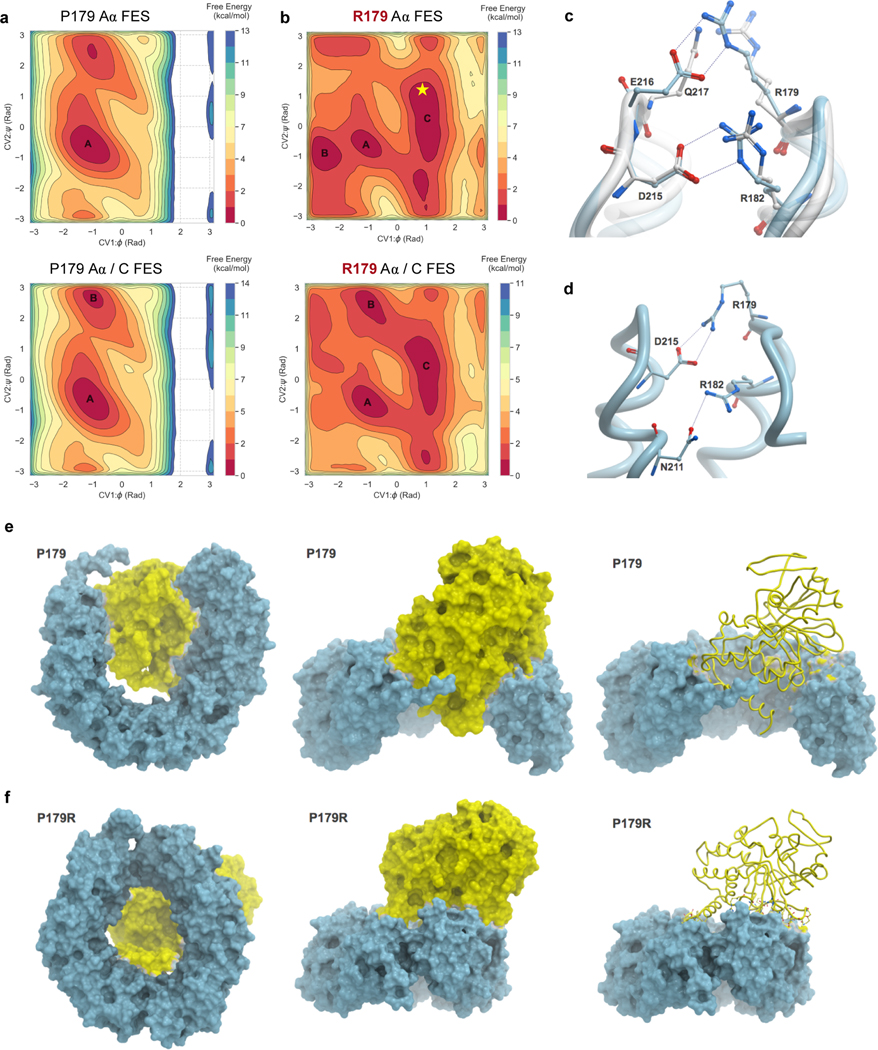
Figure 3. Molecular modeling reveals distinct conformational dynamics of the P179R-Aα mutant protein.
a–b, Free energy surfaces (FES) plots of the apo Aα-subunit (top) and Aα/C complex (bottom) generated as a function of φ and ψ dihedral angles of residues P179 and R179. a, The P179 wildtype residue explores a similar conformational landscape in both apo and complex states. b, By comparison, the R179 mutant FES is modified, indicating sampling of additional conformations. The landscape between apo and complex states of R179 is also altered, highlighting additional sampling of interactions when in the Aα/C complex. Labelled basins represent energy minima, with basins A and C representing the most populated minima for P179 and R179, respectively. The resolved crystal structure (Figure 2d–e) extrapolates onto basin C of R179, indicated by the star. c–d, A comparison of inter-residue interactions made by R179. c, Overlay of the P179R-Aα crystal structure (white), with the representative conformation extracted from the largest populated basin of the apo R179 Aα FES (cyan). In the crystal structure, R179 makes ion pair interactions with Q217 while R182 interacts with D215. In the simulated apo P179R-Aα, R179 interacts with E216 while the interaction between R182 and D215 remains unaltered. d, In the representative conformation of P179R-Aα in the Aα/C complex, R179 makes an ion pair with D215 while R182 interacts with the side chain of N211. e–f, Conformational changes observed in the representative structures extracted from the most populated minima for the WT Aα/C complex (e) and the P179R mutant Aα/C complex (f).

