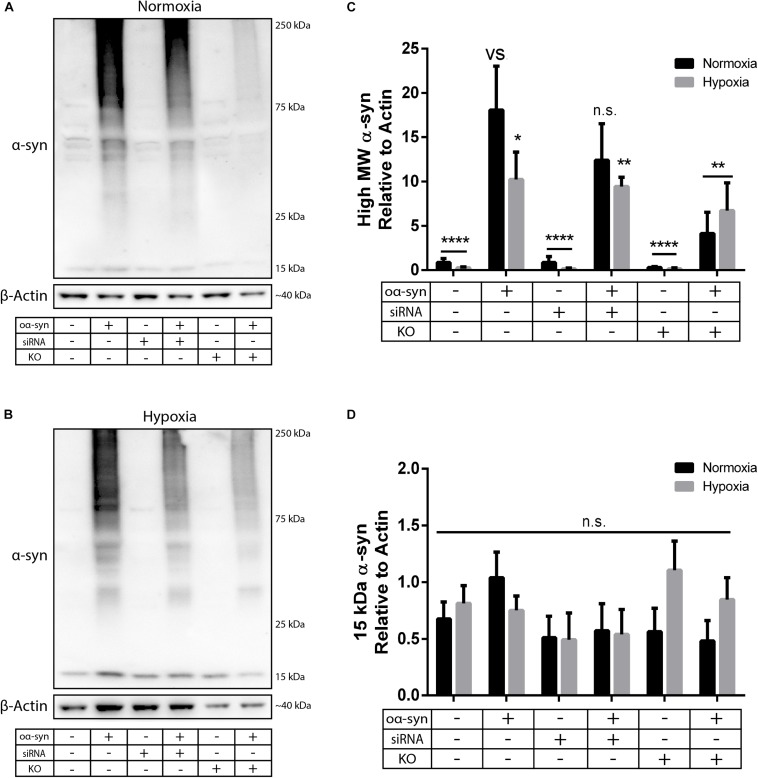
FIGURE 4.
nSMase2 inhibition reduces the aggregation of high molecular weight (MW) α-syn. (A,B) Expression of α-syn in donor cells, as determined by Western blot, under (A) normoxia and (B) hypoxia. (C,D) Quantification of (C) high MW α-syn (∼25–250 kDa) and (D) 15 kDa monomeric α-syn expression relative to β-actin expression. The data are presented as the mean ± SEM (n = 3). ∗p ≤ 0.05, ∗∗p ≤ 0.01, ∗∗∗∗p ≤ 0.0001 versus (vs) oα-syn treatment.

