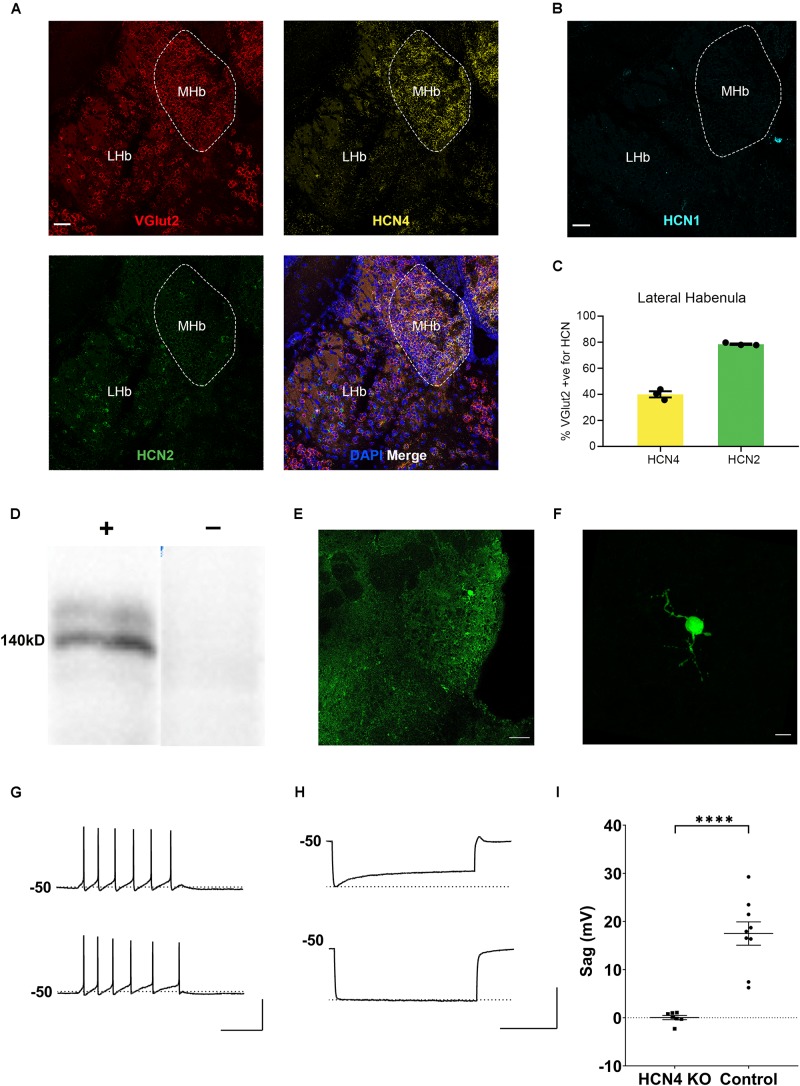
FIGURE 2.
HCN4 channels support Ih in the medial habenula. (A) Representative confocal images (single optical slice) of the lateral and medial habenula (LHb, MHb) showing VGlut2, HCN4, and HCN2 mRNA expression presented individually and as a composite with DAPI staining. Scale bar = 50 μm. (B) Representative confocal images (single optical slice) of LHb and MHb showing HCN1 mRNA expression from a different slice. Scale bar = 50 μm. (C) Percentage of VGlut2-positive neurons in the LHb expressing HCN4 or HCN2 mRNA. (D) Western blot analysis of a Nestin-HCN4 knockout mouse (–) and Nestin-Cre control (+). (E) Biocytin-filled neuron identifying a recorded neuron in the medial habenula. Scale bar = 50 μm. (F) Maximum intensity projection of the identified neuron. Scale bar = 10 μm. (G) Example traces showing action potential firing at rheobase in a medial habenula neuron from a Nestin-Cre control mouse (upper) and from a Nestin-HCN4 knockout mouse (lower). Scale bar = 200 ms (x axis), 50 mV (y axis). (H) Example traces of “sag” on the voltage recording (average of 5–10 sweeps) from a Nestin-Cre mouse (upper) and from a Nestin-HCN4 knockout mouse (lower). Scale bar = 2 s (x axis), 50 mV (y axis). (I) Scatter plot comparing “sag” in medial habenula neurons from Nestin-HCN4 knockout mice (7 cells) and Nestin-Cre mice (9 cells). ∗∗∗∗p < 0.0001.

