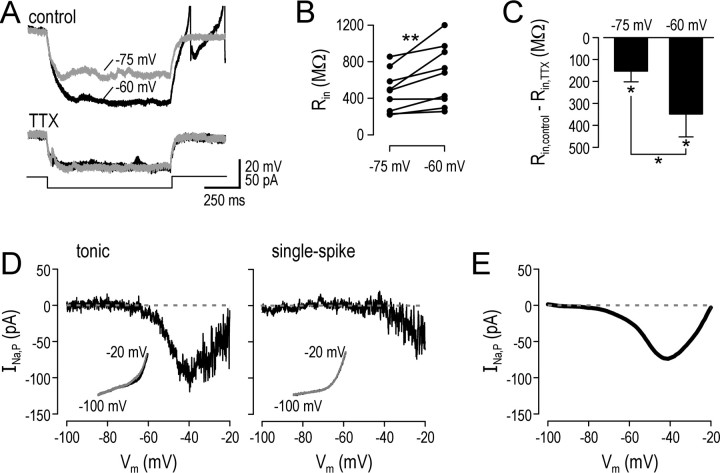
Figure 5.
Tonic neurons express a persistent sodium current (INa,P). A, Responses from a typical tonic neuron illustrate that, under control conditions, Rin calculated from small hyperpolarizing steps from prestimulus Vm of -60 mV was 1190 MΩ, whereas from prestimulus Vm of -75 mV it was 780 MΩ. Voltage sensitivity of Rin was significantly less after TTX. TTX itself reduced Rin to 560 and 585 MΩ for Vm of -60 and -75 mV, respectively. This is consistent with a TTX-sensitive inward current that is persistently active at -60 mV and less so at -75 mV (a simple calculation suggests 23 and 7 pA, respectively) being deactivated by hyperpolarization. B, Cumulative data showing voltage sensitivity of Rin calculated from 20 pA hyperpolarizing steps under control conditions. Rin calculated from prestimulus Vm of -75 mV was 24 ± 5% less than Rin calculated from prestimulus Vm of -60 mV (n = 9; **p < 0.01; Wilcoxon signed-rank test). C, Effect of TTX on Rin expressed as difference in Rin before and after TTX for different prestimulus Vm. The effect at -60 mV was significantly greater than at -75 (n = 5; *p < 0.05; Wilcoxon signed-rank test), although both changes were significant relative to 0 (*p < 0.05; Wilcoxon signed-rank tests). D, I-V curves were measured in voltage clamp by ramping command voltage at 10 mV/s between -110 and -10 mV. Insets show response before and after TTX (black and gray, respectively), and main graphs show the difference. The representative tonic cell clearly exhibited a TTX-sensitive inward current that peaked at approximately -40 mV but was still active at subthreshold potentials, consistent with amplitudes calculated in A. A representative single-spike cell showed no such inward current. E, I-V curve averaged across three tonic neurons tested and smoothed with a running average.

