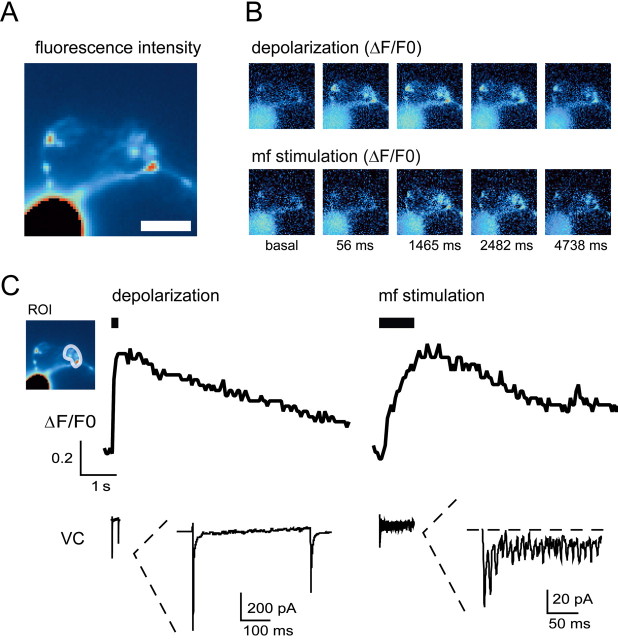
Figure 2.
Ca2+ transients elicited by either membrane depolarization or high-frequency mf stimulation. A, Unprocessed fluorescence image of a GrC filled with 200 μm OG1. Scale bar, 5 μm. Fluorescence intensity is color coded with arbitrary units within an interval chosen to allow the visualization of the synaptic terminals (note that, although the soma fluorescence appears saturated within this interval, it does not saturate the CCD detectors). The shape of a glomerulus is clearly visible at the terminal portion of the dendrite. B, During voltage-clamp recordings, we measured the Ca2+ transients induced either by a 200 ms depolarization from -70 to 0 mV or by high-frequency mf stimulation (1 s at 100 Hz) while holding the GrC at -70 mV in the absence of extracellular Mg2+. The corresponding time series of pseudoratio images from this GrC (warmer color code for higher ΔF/F0) is shown. The Ca2+ increase is maximal at the level of the glomerulus during both depolarization and mf stimulation. C, ΔF/F0 is evaluated in the ROI (inset) at the level of the glomerulus for the same cell as in A and B. Depolarization and mf stimulation induce Ca2+ transients of similar maximal amplitude at the synaptic level. In this and subsequent figures, depolarization and mf stimulation are indicated by black bars. The voltage-clamp (VC) current elicited by depolarization and mf stimulation is shown at the bottom on the same time scale as the Ca2+ transient and is expanded in the inset. During depolarization, a large peak Na+ current is followed by a persistent component partially masked by outward K+ currents (the Ca2+ current is clearly visible only under selective ionic conditions) (Rossi et al., 1994). During mf stimulation, the EPSC oscillations are associated with a steady current mostly determined by NMDA channels (Rossi et al., 2002).

