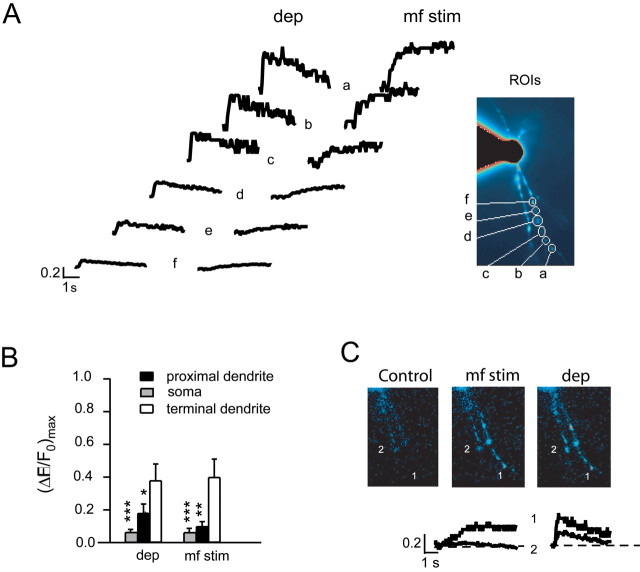
Figure 3.
Dendritic specificity of Ca2+ signaling. A, Ca2+ transients are measured at different dendritic positions (from a to f) and are induced either by a 200 ms depolarization (dep) from -70 to 0 mV or by high-frequency mf stimulation (mf stim; 1 s at 100 Hz) while holding the cell at -70 mV in the absence of extracellular Mg2+. Note the decrease in ΔF/F0 from the dendritic ending to the soma. Inset, Unprocessed fluorescence image revealing four dendrites in the focal plane, with indication of ROIs a-f used for ΔF/F0 measurement. B, The histogram shows ΔF/F0 at the end, amid, and at the origin of the dendrite during mf stimulation or membrane depolarization for seven recordings (including the one shown in A). Data are reported as mean ± SEM, and statistical difference from dendritic terminals is indicated: *p < 0.05; **p < 0.01; ***p < 0.001. C, Pseudoratio images from the GrC in A showing ΔF/F0 in control (left), in response to mf stimulation (middle), and in response to depolarization (right). Note the prominent ΔF/F0 increases in dendrite 1 with mf stimulation and in both dendrites 1 and 2 during membrane depolarization (same cell as in A). The tracings below the images indicate ΔF/F0 in the dendritic terminals 1 and 2 during mf stimulation and membrane depolarization. Error bars represent SEM.

