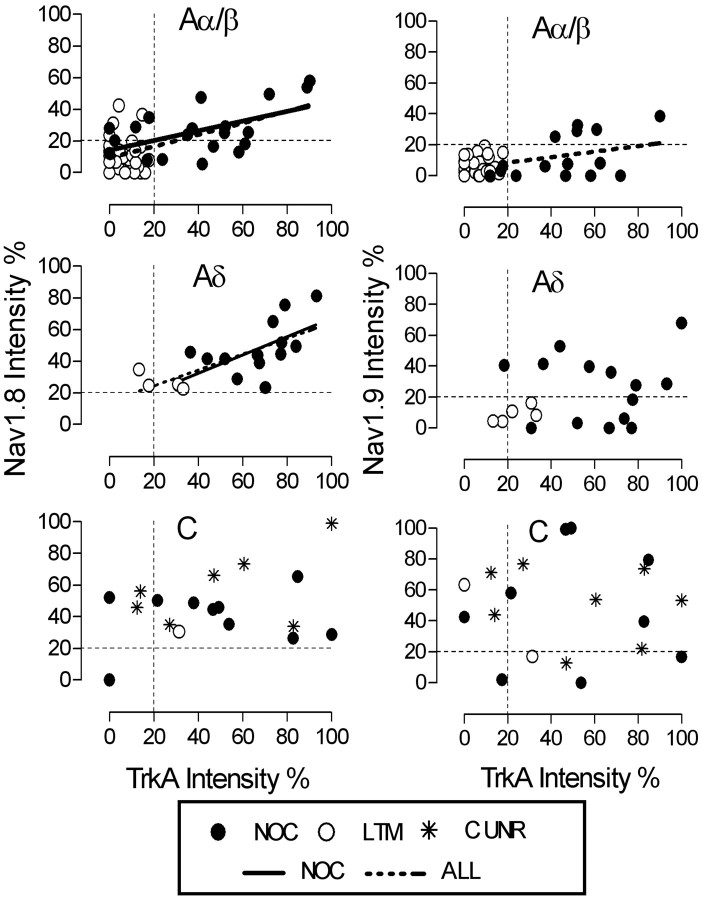
Figure 4.
trkA intensity versus Nav1.8 (left) or Nav1.9 (right) intensity in different sections from the same identified neurons. A-fiber unresponsive neurons are excluded. Left, A linear correlation between trkA intensity and Nav1.8 intensity exists in all Aα/β units (p < 0.0001; r2 = 0.36); Aα/β nociceptors (p < 0.005; r2 = 0.29); all Aδ units (p < 0.005; r2 = 0.48); Aδ nociceptors (p < 0.005; r2 = 0.38). No such correlation is in C-fiber units (p > 0.05). Right, There is a linear correlation between trkA intensity and Nav1.9 intensity only in all Aα/β units (p < 0.005; r2 = 0.17). The vertical and horizontal dotted lines from y-axis and from x-axis indicate the borderlines between positive and negative for trkA and for Nav1.8 or Nav1.9, respectively. NOC, Nociceptive; C UNR, C-fiber unresponsive. For p, n, and r2 values, see Results.

