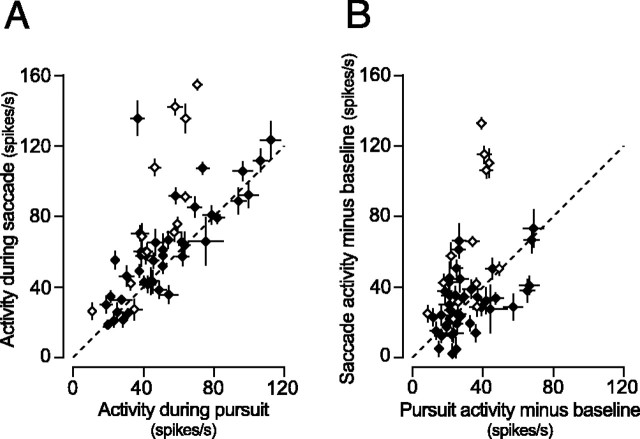
Figure 9.
Comparison of activity during pursuit at 20°/s and memory-guided saccade of 16°. A, Each data point plots mean ± SE firing rate measured for a 400 ms (pursuit) and a 150 ms (saccade) interval. Open symbols indicate data for 13 neurons that showed modulation of activity around the time of catch-up saccades. B, Scatter plot comparing the magnitude of responses to different types of eye movements. For each neuron, baseline activity was subtracted from data shown in A. Baseline activity was measured for 400 ms before target motion or 300-200 ms before saccade initiation.

