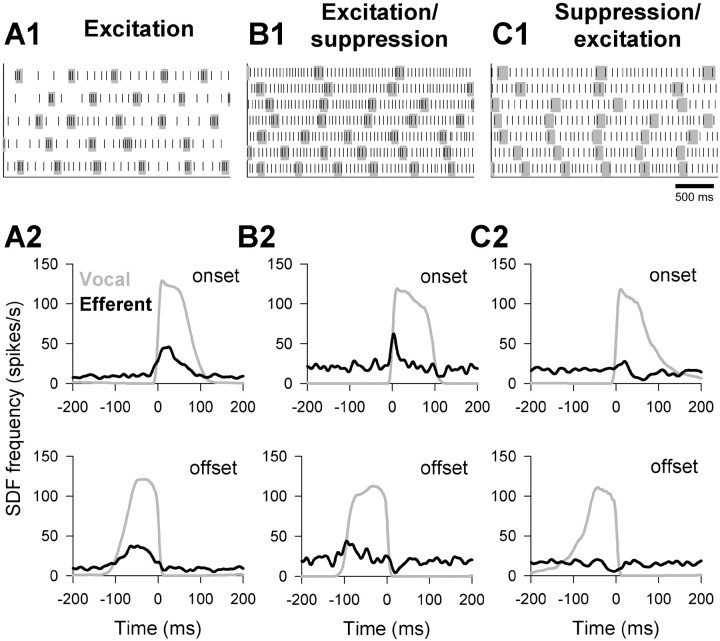
Figure 3.
Neuronal activity changes in caudal efferent bundle neurons during fictive vocalizations. Raster diagrams of three representative neurons (A1, B1, C1) show raw data of efferent activity (black) during fictive vocalizations (gray), whereas spike density functions (A2, B2, C2) provide the average efferent activity relative to the onset or offset of fictive vocalizations. Three patterns of efferent activity were evident: A1, A2, excitation showed increased activity at fictive vocal onset; B1, B2, excitation/suppression showed increased activity at fictive vocal onset and decreased activity at fictive vocal offset; C1, C2, suppression/excitation showed suppression of activity during fictive vocalizations that was usually preceded by brief excitation. Scale bar represents time scale for A1, B1, C1.

