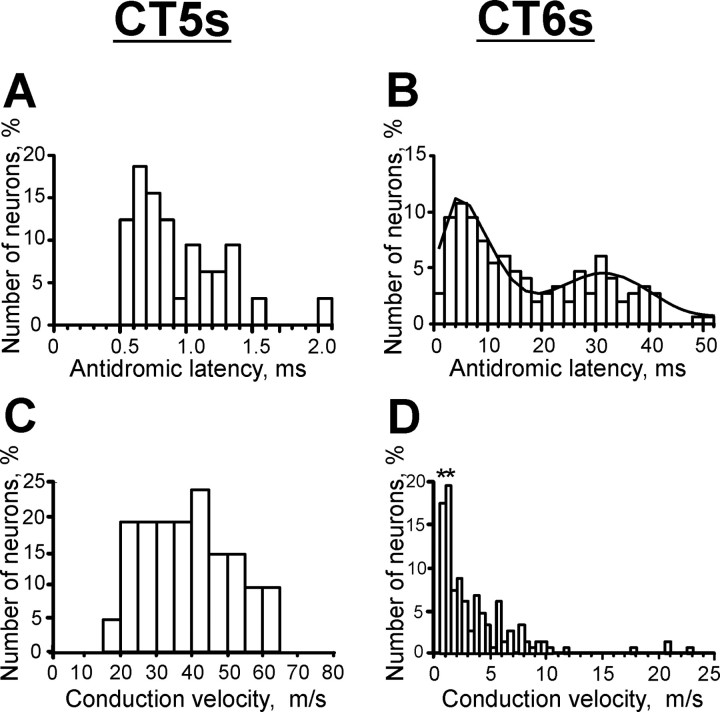
Figure 3.
Comparison of axonal conduction velocities of CT5 and CT6 neurons. A, B, Distribution of antidromic latencies to thalamic stimulation of CT5 (A) and CT6 (B) neurons. Note that there is little overlap in these distributions, and the distribution of CT6s is bimodal, which is highlighted with a polynomial curve. C, D, Distribution of conduction velocities of CT5 (C) and CT6 (D) axons projecting to VL. In D, bins with conduction velocities of CT6s with antidromic latency >20 ms are denoted with asterisks.

