
Figure 4.
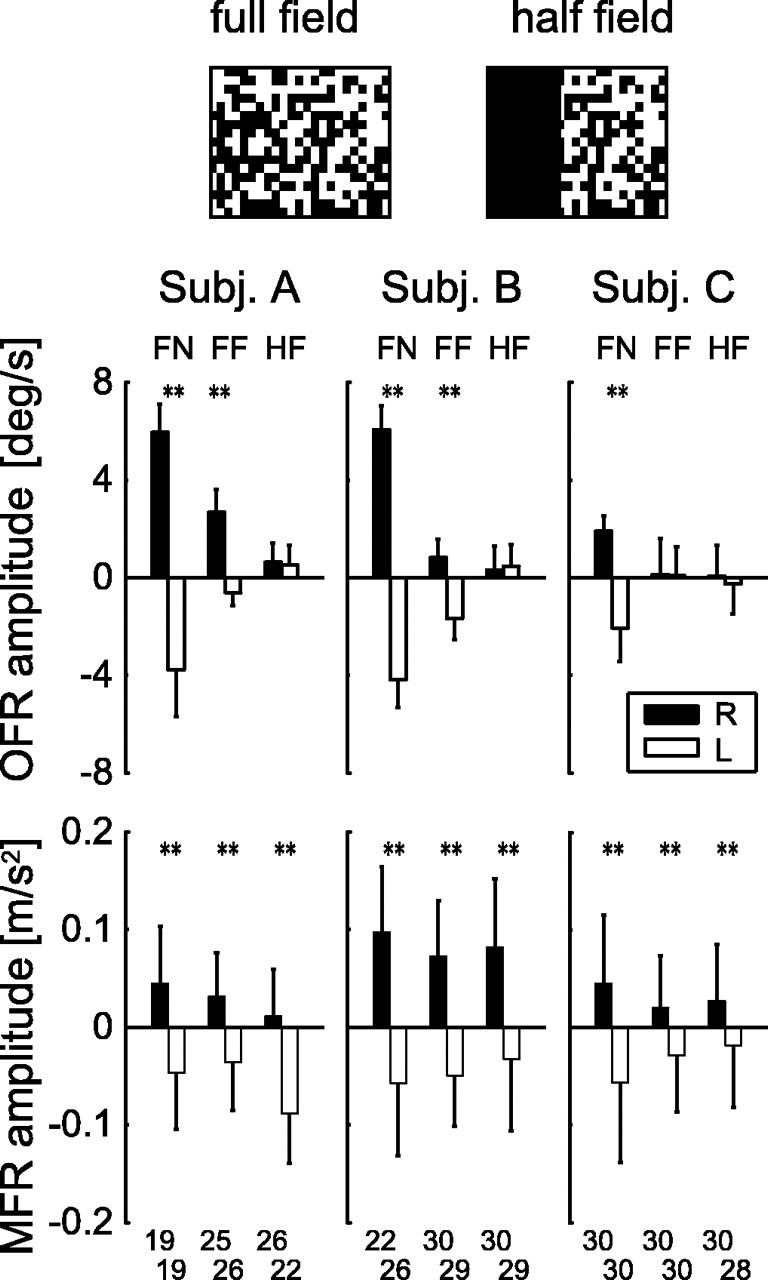
Amplitude changes in the OFR and MFR by fixation spot and stimulus reduction. The top diagram represents the full- and half-field visual stimuli displayed on the screen (for details, see Materials and Methods). The top three panels show the OFR amplitudes (temporal mean ocular velocity between 150 and 200 ms after the stimulus onset) for three subjects (Subj.) for the rightward (R; filled bar) and leftward (L; open bar) visual motions in three conditions: FN, FF, and HF. The bottom three panels show the MFR amplitudes (mean hand acceleration change from the control response in the x direction between 150 and 200 ms after the stimulus onset) for the same three subjects recorded simultaneously with the ocular movement. Each error bar denotes intertrial variation (SD) in each condition. The trials with saccadic intrusion were excluded from both ocular and arm movement data before averaging. Each number placed at the bottom of the graph denotes the number of trials for averaging and statistical tests. The double asterisks above the bar-pair denote the statistical significance (p < 0.01) of the difference between these mean amplitudes. deg, Degrees.