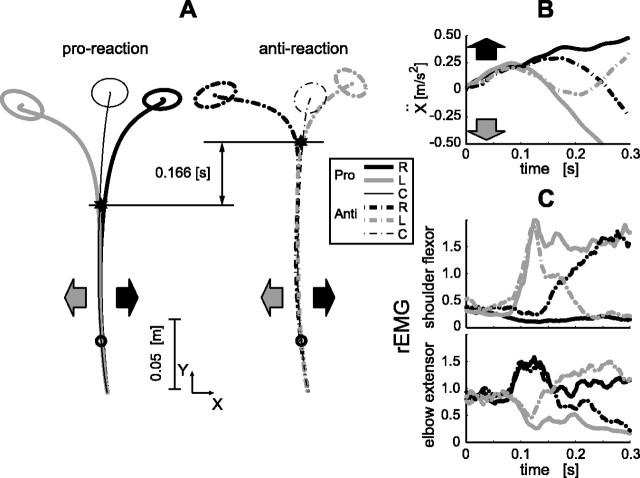
Figure 5.
Manual responses in voluntary proreaction (Pro) and antireaction (Ant) tasks. A, Averaged trajectories (30 trials each for the left and right, 40 trials for the control) in proreaction and antireaction tasks for the subject whose data are shown in Figure 2. Timings of trajectory deviations (star marks) detected by successive t tests for positions were greatly different (166 ms) between these two tasks. B, C, x acceleration (B) and the rEMG (C) in the proreaction and antireaction tasks. In all graphs, the thick black curve represents the rightward (R) stimulus response, the thick gray curve represents the leftward (L) stimulus response, the thin black curve represents the control (C; no visual motion) response, the solid curve represents the proreaction task, and the dash-dot curve represents the antireaction task. Black and gray arrows denote the stimulus directions (rightward and leftward, respectively).

