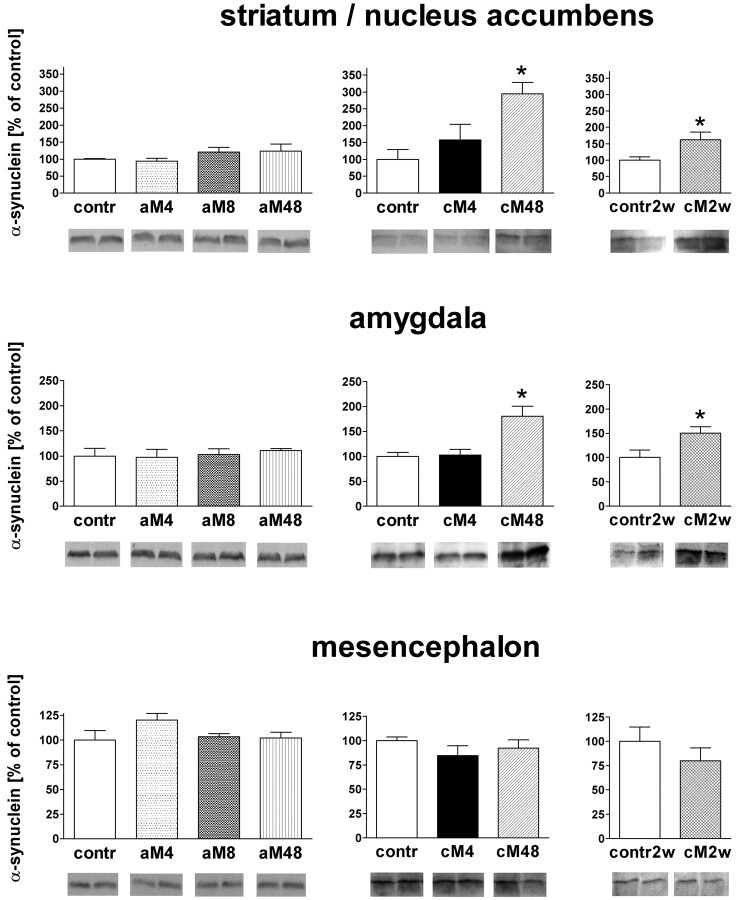
Figure 4.
Western blot analysis of the influence of morphine treatment and withdrawal on levels of α-synuclein in the striatum/accumbens, amygdala, and mesencephalon. contr, Control groups injected acutely or chronically with saline and killed 4 h after the (last) injection; contr2w, control group injected chronically with saline and killed 2 weeks after the last injection; aM4, aM8, and aM48, groups injected acutely with morphine and killed after 4, 8, and 48 h, respectively; cM4, cM48, and cM2w, groups of mice treated chronically with morphine and killed 4 h, 48 h, and 2 weeks after the last injection, respectively. The results are presented as mean ± SEM (expressed as percentage of control) of five animals per group. Asterisk indicates statistical significance (p < 0.05 or less) versus the respective control group (cM48 vs contr by ANOVA, followed by Tukey's test; cM2w vs contr2w by the two-tailed unpaired t test).

