Figure 2.
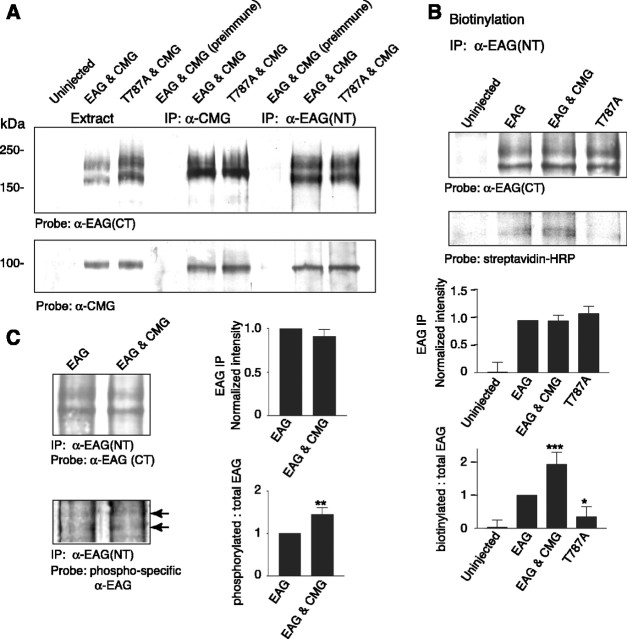
CMG associates with EAG and increases EAG surface expression and phosphorylation. A, Coimmunoprecipitation of EAG and CMG from Xenopus oocyte extracts. Lanes 1-3 show oocyte extracts for comparison; lane 4, immunoprecipitation with preimmune sera; lanes 5 and 6, immunoprecipitation with indicated antibody. CMG associates with both wild-type and EAG-T787A channels. Top (lanes 5, 6), Immunoprecipitation with CMG antisera. Bottom (lanes 5, 6), Reverse immunoprecipitation with EAG (NT) antisera. Similar results were observed in five experiments. Respective loads were 5, 10, and 20 μl for extracts, immunoprecipitated proteins, and coimmunoprecipitated proteins, respectively (see Materials and Methods). B, CMG and phosphorylation of EAG-T787 both increase EAG surface expression. Top, Oocytes were labeled with biotin for 30 min and then quenched with glycine as described in Materials and Methods before preparation of oocyte extracts. For each condition, 600 μl of extract obtained from 50 oocytes was used for immunoprecipitation with EAG (NT) antisera. Proteins were separated by SDS-PAGE, transferred to PVDF membranes, blotted with the indicated antisera, and processed with ECL. Gels were run in parallel with equal amounts of the precipitates. Bottom, Streptavidin-labeled bands were quantified by densitometry and normalized to the intensity of the EAG band in each experiment; data are presented as the mean ± SEM; n = 3 (*p ≤ 0.05; **p ≤ 0.01; ***p ≤ 0.005). C, CMG increases phosphorylation of EAG-T787. Top, EAG was immunoprecipitated from oocyte extracts with EAG (NT) antisera. Gels were run in parallel, proteins transferred to PVDF membranes, which were then probed with either EAG (CT) antisera (top) or antibody recognizing EAG phosphorylated at T787 (bottom) (Wang et al., 2002). Bottom, EAG labeled by phospho-specific antibody. Bands were quantified by densitometry and normalized to the EAG (CT)-labeled band and the corresponding region of the uninjected oocyte lane for each experiment; data are presented as the mean ± SEM; n = 3; p values as in C. IP, Immunoprecipitation.

