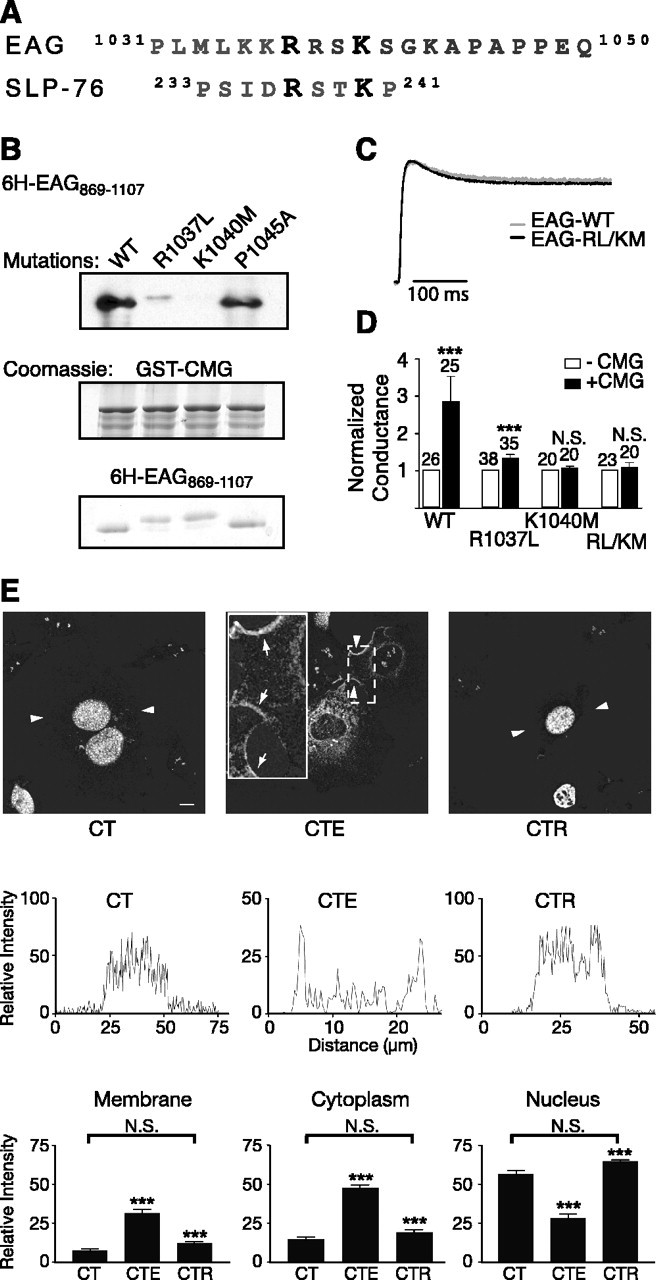
Figure 6.

A noncanonical SH3-binding motif in EAG mediates the EAG-CMG interaction. A, Comparison of the amino acid sequence surrounding the fourth putative SH3-binding motif to the amino acid sequence of the noncanonical SH3-binding site in SLP-76, the Src homology 2 (SH2) domain containing a leukocyte protein of 76 kDa. Note that both proteins also contain prolines in the nearby sequence. B, In vitro binding assays comparing the association of 6H-EAG869-1107 and mutant EAG fragments (R1037L, K1040M, and R1037L/K1040M EAG) to GST-CMG, as indicated. Top, Immunoblotting with MRGS-6H antibody to detect interacting EAG fragments. Middle and bottom, Coomassie-stained gels showing the relative amounts of GST-CMG and EAG fragments present in each interaction experiment. C, Scaled representative traces obtained for wild-type and EAG-R1037L/K1049M channels. Currents were elicited by a 400 ms test pulse to +40 mV from a holding potential of -80 mV. Peak current amplitudes were 2.2 and 5.0 μA for EAG and EAG-R1037L/K1040M, respectively. D, Mutations in the EAG-binding site inhibit the effect of CMG on EAG conductance. Fold increase in the whole-cell conductance as a function of CMG coexpression for oocytes expressing wild-type, R1037L, K1040M, and R1037L/K1040M EAG channels. Conductances were determined as described in Figure 1G in response to a test pulse to 60 mV (holding potential, -80 mV). To normalize for normal variations in expression across different batches of oocytes, the mean conductance in the presence of CMG was normalized to the mean conductance obtained for oocytes expressing only EAG or the indicated EAG mutants. The SE and number of oocytes examined for each condition is indicated above each bar. The effect of CMG was statistically analyzed using a two-way ANOVA with oocyte batch and CMG as variables (***p < 0.001; N.S., not significant). WT, Wild type. E, Disruption of the CMG-binding site also disrupts the ability to compete with Tbr-1 and recruit CMG out of the nucleus of COS-7 cells. Top, Background-subtracted images for three expression conditions: CMG and Tbr-1 (CT), CMG, Tbr-1, and EAG (CTE), and CMG, Tbr-1, and EAG-RL/KM (CTR). Arrowheads indicate the segments used for the line scans presented in the middle panels. Scale bar, 10 μm. Middle, Representative line scans obtained as described in Figure 3C. Bottom, Averaged, normalized line scan data from three separate experiments examining the distribution of CMG to the cytoplasm, nucleus, and membrane for the three expression conditions. One-way ANOVA comparisons of fluorescence intensity between CT versus CTE and CTE versus CTR conditions were significant (***p < 0.001). In contrast, there was no significant difference (N.S.) between the CT and CTR conditions. Error bars represent SEM.
