Figure 5.
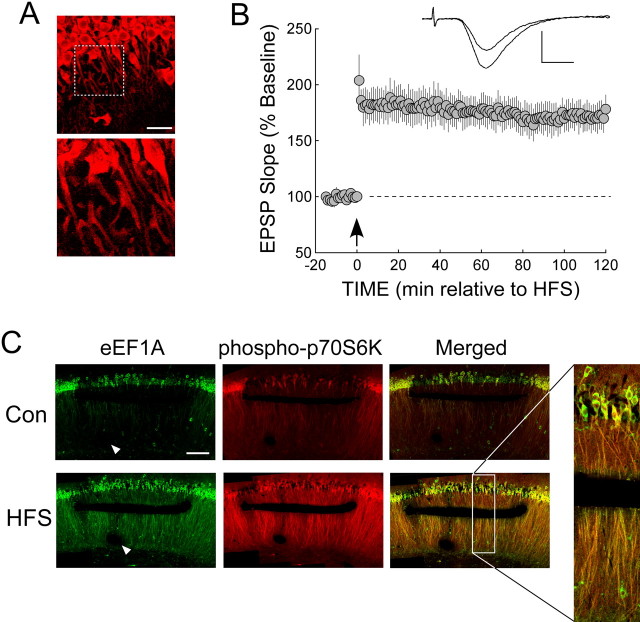
Local mechanisms are sufficient for the HFS-induced increase in dendritic eEF1A. A, FISH with oligonucleotide probes based on the mRNA sequence for rat eEF1A. In sections prepared from perfusion-fixed rat brain, mRNA for eEF1A was detected in area CA1 within the cell bodies of the stratum pyramidale (top image) and in the dendrites of the stratum radiatum (top image and detail in bottom image). Control FISH experiments using fluorescently labeled scrambled probe or labeled eEF1A probe in the presence of excess unlabeled eEF1A probe gave no detectable signal above background when imaged at the same exposure (data not shown) (Chan et al., 2005). These control studies demonstrate that the labeling observed in neuronal processes is specific for eEF1A sequence. Scale bar, 50 μm. B, LTP was recorded in the CA1 stratum radiatum of slices in which a cut separated the apical dendrites from the cell bodies proximal to the recording electrode. Strong HFS delivered 2 h after the cut had been made (see Materials and Methods) produced a stable LTP that was maintained for 2 h (n = 5). The inset traces show superimposed fEPSPs recorded during the baseline period and 2 h after HFS. Calibration: 1 mV, 5 ms. C, The HFS-induced increase in eEF1A expression was intact in dendrites separated from their cell bodies. Immunohistochemical analysis was performed on slices in which cuts had been made in the stratum radiatum before control stimulation (Con; top images) or two-train HFS (bottom images). The slices were fixed 1 h after stimulation. The HFS-induced increases in the phosphorylation of S6K at T389 (middle panels), and, more importantly, the expression of eEF1A (left panels) in the separated dendrites were similar to those obtained in the adjacent intact dendrites. Merged images of phospho-S6K and eEF1A immunofluorescence (right panels and expanded image) show a high degree of colocalization for the active mTOR pathway and the expression of eEF1A within the separated dendrites. These images are representative of three experiments for phospho-S6K and four experiments for eEF1A. The arrowhead indicates the placement of the recording electrode. Scale bar, 150 μm.

