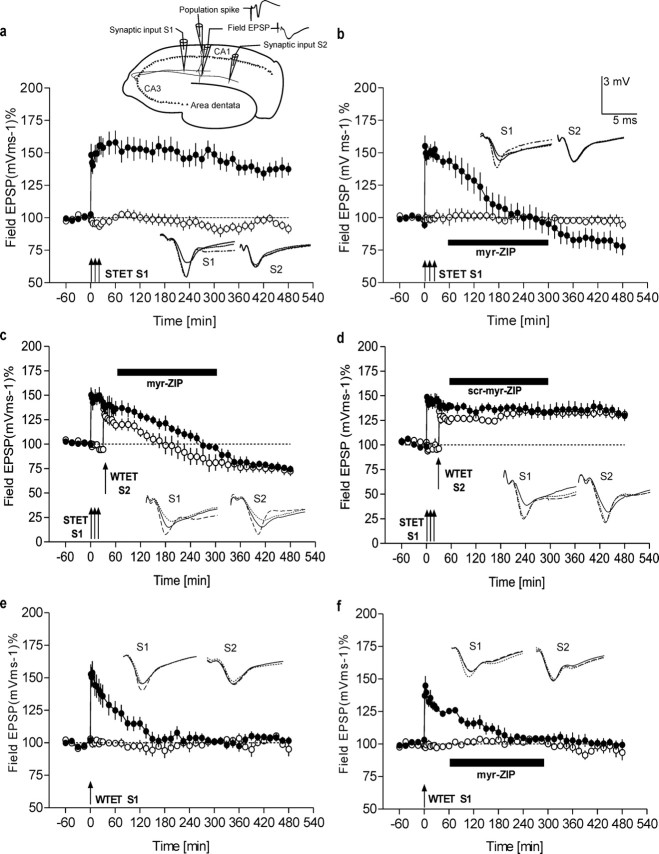
Figure 1.
Effects of PKMζ inhibition on LTP maintenance and synaptic tagging. a, Late LTP. The top scheme represents a transverse hippocampal slice showing the positioning of the electrodes. The two independent synaptic inputs, S1 and S2, to the same neuronal population and the recording sites for the population spike amplitude and the field EPSP, as well as analog recording traces as representative examples, are shown. The graph illustrates that the induction of late LTP in S1 (STET; filled circles) using high-frequency stimulation (HFS) resulted in late LTP that was significantly different for 8 h, compared with the control input S2 (open circles; n = 8; p < 0.05; U test). Control stimulation of S2 showed relatively stable potentials for the time course investigated. b, Inhibition of PKMζ reverses LTP maintenance. Induction of late LTP (n = 7) by applying HFS to S1 (filled circles) and application of the myristoylated ζ-pseudosubstrate peptide inhibitor (1 μm; black bar) 1 h after its induction reversed the late phase of LTP, whereas the potentials of the control path way S2 remained stable throughout the recording period of 8 h (open circles). c, Inhibition of PKMζ reverses late LTP maintenance at tagged synapses. Induction of late LTP (filled circles) in S1, followed by the induction of early LTP in S2 (open circles) by WTET and subsequent application of myr-ZIP 30 min after WTET to S2 (1 μm; black bar; n = 7), is shown. LTP in S1 reversed to baseline 210 min after STET, and the potentiation in S2 reached pretetanization baseline values 120 min after WTET (n = 7; p < 0.05; Wilcoxon test). d, scr-myr-ZIP had no effect on synaptic tagging (1 μm). Late LTP in S1 (filled circles) remained stable over 8.5 h, and synaptic tagging was observed in S2 (open circles). The transformation of early into late LTP in S2 by the previous induction of late LTP in S1 was maintained for 8 h, compared with pretetanization levels (n = 4). e, f, Early LTP. Induction of early LTP by a weak tetanus in S1 (filled circles) revealed a transient potentiation with a duration of 135 min (compared with control input S2; open circles in e; n = 5; p < 0.05; U test). Inhibition of PKMζ after induction of early LTP (f; n = 5) revealed a time course in both inputs similar to that observed in the control series without drug treatment [early LTP was maintained for 135 min in S1 (filled circles) when compared with control input S2 (open circles); p < 0.05; U test]. Analog traces represent typical field EPSPs 30 min before (solid line), 30 min after (hatched line), and 8 h after (dotted line) tetanization of input S1 or, in cases in which S2 was also tetanized, before or after the tetanization of that input. Arrows indicate the time point of tetanization. Bars represent the period of drug application. Error bars represent means ± SEM.

