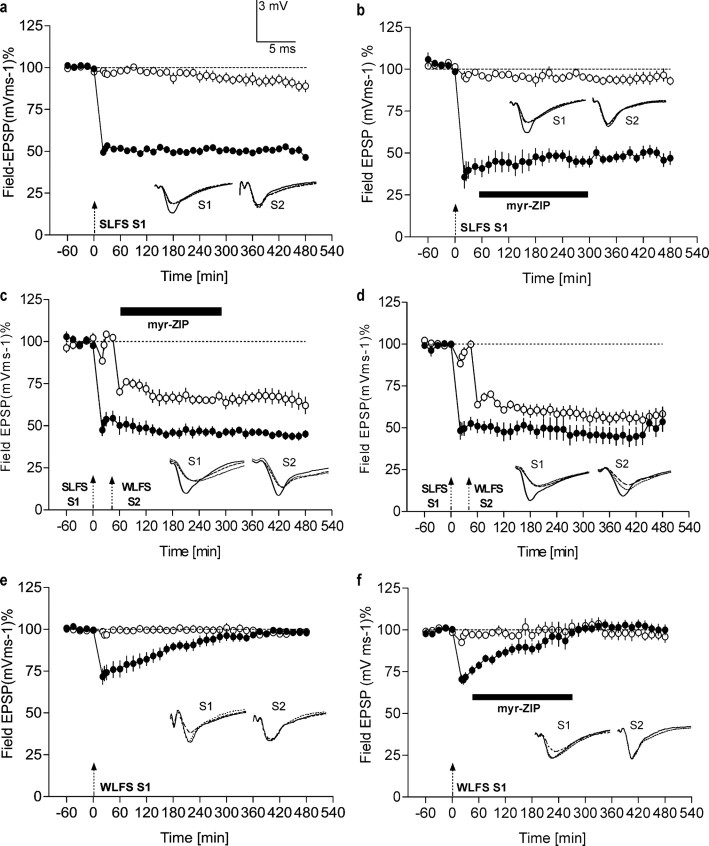
Figure 2.
Effects of PKMζ inhibition on LTD maintenance and synaptic tagging. a, Late LTD. Application of an SLFS to S1 (filled circles) resulted in a significant depression of that input, compared with a control input S2 (open circles; n = 7; p < 0.05; U test). b, Late LTD that was induced using the same protocol as in a was unaffected when the myr-ZIP (1 μm; n = 7) was bath applied 1 h after its induction (filled circles). c, d, Synaptic tagging during LTD under the influence of myr-ZIP. c represents the time course of the field EPSP after SLFS of S1 (filled circles) followed by WLFS in S2 (open circles) and subsequent application of myr-ZIP (n = 5). This protocol resulted in synaptic tagging (i.e., in the transformation of early into late LTD of S2) regardless of the blockade of PKMζ activity by myr-ZIP. d represents a control series of synaptic tagging during LTD without drug treatment (n = 10). e, f, Early LTD. e, Time course of control early LTD in S1 (filled circles) induced by a WLFS (dashed arrow; n = 10) with a duration of 185 min (compared with control input S2; U test; p < 0.05; n = 6). f, This early LTD was unaffected when the myr-ZIP was applied 1 h after its induction. Control stimulation of S2 in e and f showed relatively stable potentials for the time course investigated (open circles). Analog traces represent typical field EPSPs 30 min before (solid line), 30 min after (hatched line), and 8 h after (dotted line) low-frequency stimulation of input S1 or, in cases in which S2 was also treated with LTD-inducing stimulation, before or after the LFS of that input. Dashed arrows represent weak or strong low-frequency stimulation of the corresponding synaptic input. Bars represent the period of drug application. Error bars represent means ± SEM.

