Figure 6.
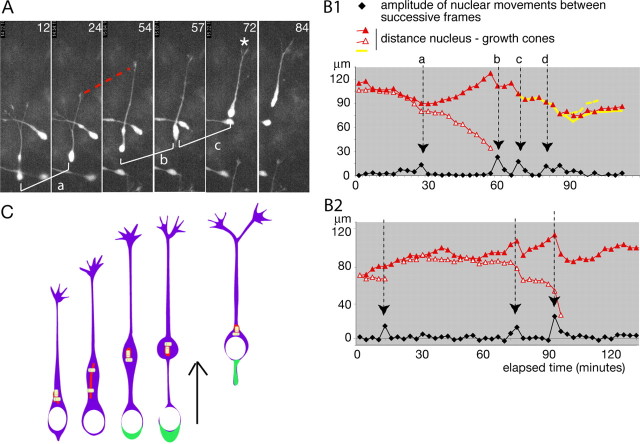
Neuritic elongation and nuclear migration are correlated in MGE cells. A, Frames of the time-lapse sequence depicted in B1. A GFP-expressing MGE cell migrating on wild-type dissociated cortical cells was imaged each for 3 min using a 40× objective. Elapsed time is indicated in minutes on each frame. Three nuclear translocations (a,b,c) are illustrated. Between translocations a and b, the leading process elongates (red dotted curve). A growth cone splitting (white asterisk) is visible at the end of translocation c. B1, B2, Graphs depict the sequence of migration of two MGE cells. Graph B1 corresponds to the cell illustrated in A. The black curve shows the amplitude of nuclear displacements between successive frames. Peaks in the curve (black arrows) identify translocation phases (same letters in A and B1). Colored curves represent the distance from the rostral edge of the nucleus to growth cones on each frame (leading growth cone in red). Between two nuclear translocations (black arrows), the leading neurite elongates, and the red curve hence ascends. Nuclear translocations are associated with an arrest of neuritic elongation and a shrinkage of the leading neurite. C, Schematic representation of nucleokinesis in MGE cells. During the resting phase of the nucleus (white), the centrioles (yellow) and Golgi apparatus (red) migrate forward, and the leading neurite elongates. The centrioles split, and the Golgi apparatus elongates. Then, myosin II accumulates at the rear of the cell body (green) and pushes the nucleus toward the centrosome/Golgi apparatus.

