
Figure 1.
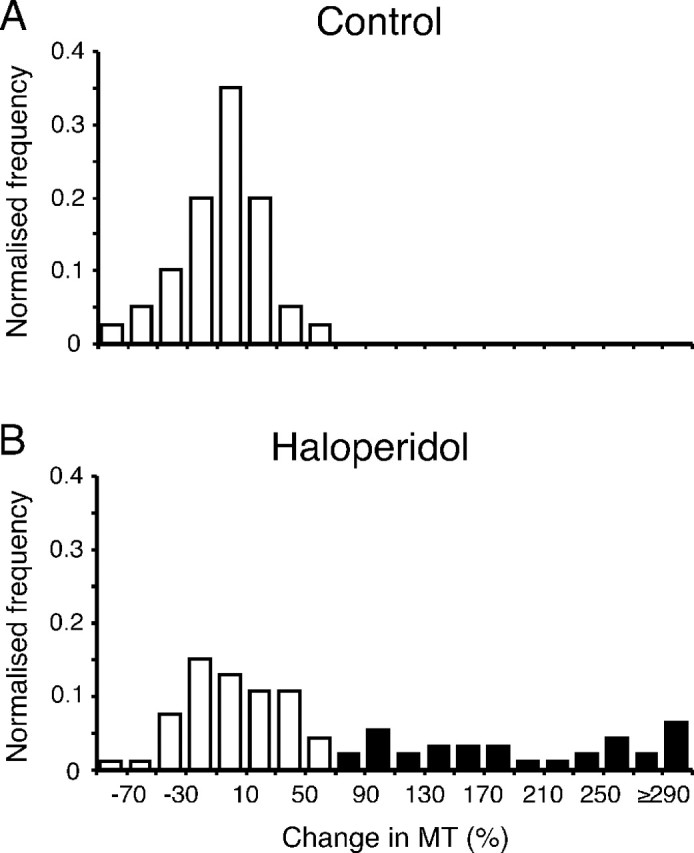
Identification of haloperidol-induced bradykinesia. Graphs show normalized frequency distributions of the change in movement time (MT) after vehicle (A) (control; n = 40) and haloperidol (B) (n = 93) injections. Bradykinetic experiments (filled columns) were defined as those exceeding the maximum percentage increase seen in control experiments.