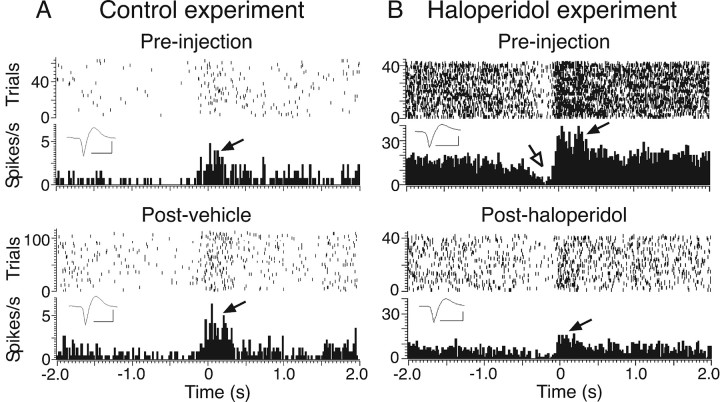
Figure 2.
Illustrative examples of dot raster and PETH analyses of baseline and movement-related cell activity and the effect of haloperidol. A, Cell recorded in a control experiment (injection of vehicle) with a significant movement-related excitation (filled arrow) and a nonsignificant inhibition. Top and bottom panels show preinjection and postinjection data, respectively. The dot rasters show each action potential in each trial, and the histograms show firing rate averaged across all trials (20 ms bins). Data are aligned to the termination of the extension phase of the reaching movement (time 0). Baseline activity was calculated from the first 1.5 s of the histogram. The inset shows averaged action potential waveforms for the spikes obtained in each recording. Calibration: 1 ms, 50 μV. B, A different cell recorded before and after induction of bradykinesia by haloperidol. Significant excitatory and inhibitory movement-related modulations in preinjection data are indicated by filled and open arrows, respectively.

