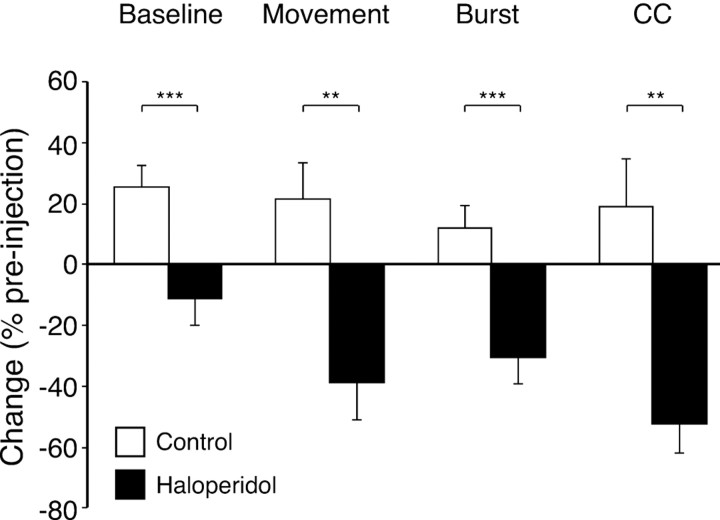
Figure 3.
Effect of haloperidol on measures of cell activity, expressed as a percentage change from preinjection values. Open bars show mean values from control (vehicle), and filled bars show changes with haloperidol-induced bradykinesia. Error bars represent SEM. Baseline, Baseline firing rate; Movement, movement-related firing rate; Burst, amplitude of autocorrelation peak; CC, amplitude of cross-correlation peak. **p ≤ 0.01, ***p ≤ 0.001; one-factor ANOVAs or Mann-Whitney U tests, comparing vehicle and haloperidol experiments.

