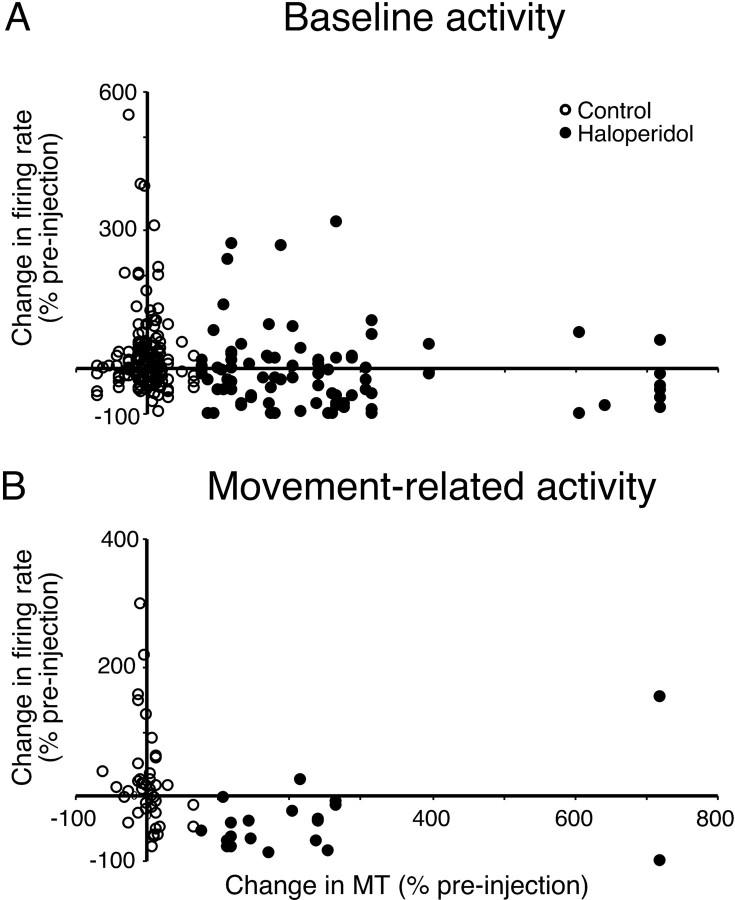
Figure 4.
Relationship between change in movement time and cell activity measures. A, Scatter plot of percentage change in baseline firing rate and percentage change in movement time (MT) for cells recorded in vehicle injection control (open circles) or bradykinetic haloperidol experiments (filled circles). B, Scatter plot of percentage change in movement time and percentage change in excitatory movement-related firing rate.

