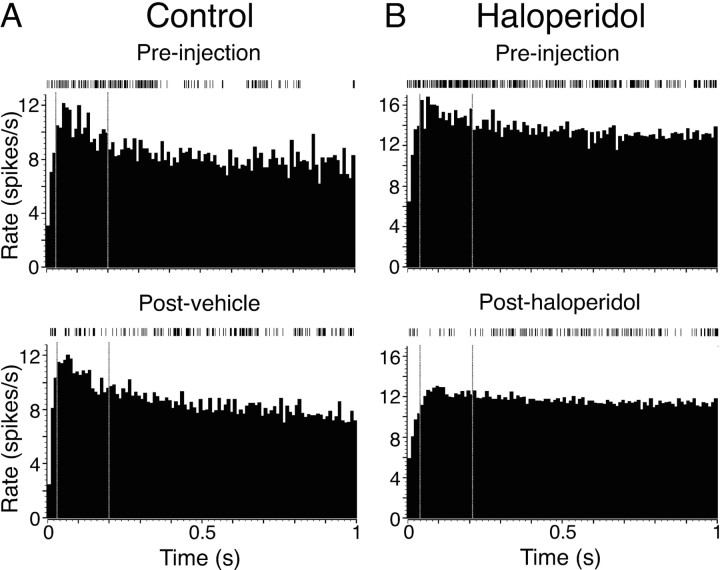
Figure 7.
Illustrative examples of changes in burst amplitude during quiet rest. Autocorrelograms show average firing rate for 1 s after each spike. A, Cell recorded in prevehicle and postvehicle periods of a control experiment. B, A different cell recorded before and after haloperidol injection. Vertical dotted lines indicate the region from which the mean amplitude of peaks was determined (region >2 SDs of histogram baseline mean, determined from preinjection histogram). Above each autocorrelogram is a 20 s sample of spike train during the rest period.

