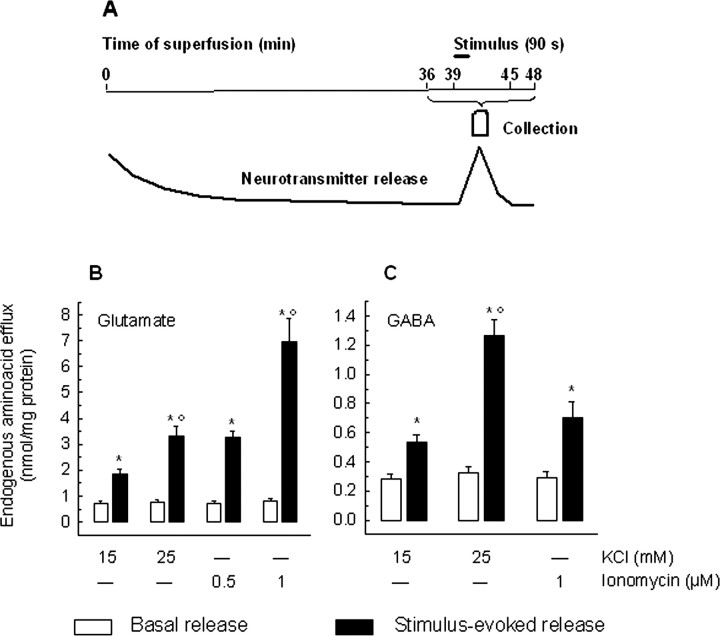
Figure 1.
A, Schematic time course of the release of a putative neurotransmitter from synaptosomes stimulated in superfusion by a depolarizing pulse. Synaptosomes were stratified on microporous filter, and neurotransmitter release was monitored during superfusion. After 36 min were allowed to equilibrate the system, two 3 min fractions (t = 36-39 min and t = 45-48 min) were collected before and after one 6 min fraction (t = 39-45 min). Synaptosomes were exposed to the stimulus (90 s) at the end of the first fraction collected (t = 39 min; see line). B, C, Characteristics of the release of glutamate and GABA from hippocampal synaptosomes exposed in superfusion to KCl or ionomycin. Synaptosomes were stratified on microporous filters, superfused, and stimulated by a 90 s pulse of KCl (15 or 25 mm) or ionomycin (0.5 or 1 μm) at t = 39 min of superfusion: the spontaneous or the stimulus-evoked release of endogenous glutamate (B) and GABA (C) was monitored. Basal outflow represents the neurotransmitter content in the two 3 min fractions collected before and after the stimulation fraction; the stimulus-evoked release represents the neurotransmitter content in the 6 min stimulation fraction, collected during and after application of the releasing pulse. *p < 0.005, when compared with respective basal outflow value; °p < 0.005, when compared with the release evoked by 15 mm KCl or 0.1 μm ionomycin, as appropriate (two-tailed Student's t test). Open bars, Basal release; filled bars, stimulus-evoked release. Error bars indicate SEM.

