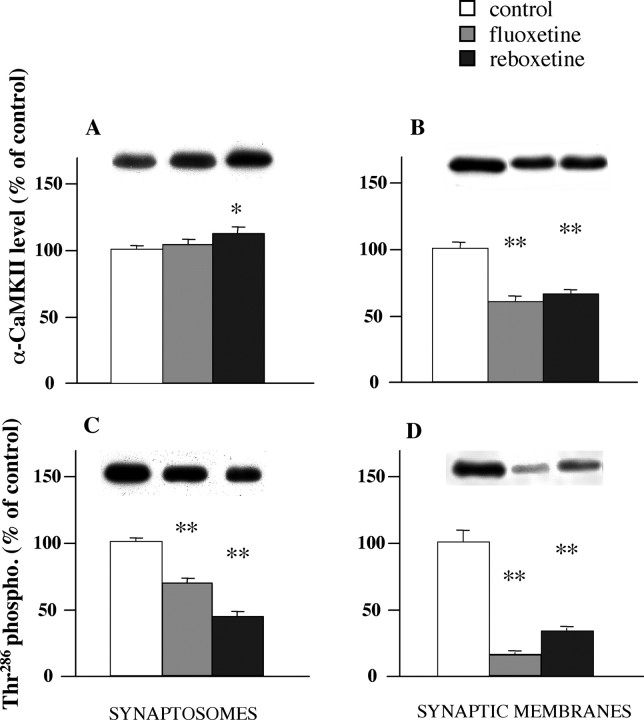
Figure 7.
Expression levels of total αCaM kinase II (A, B) and αCaM kinase II phosphorylated on Thr286 (C, D) in synaptosomes and synaptic membranes (chronic treatment). Expression levels were normalized for level of β-actin in the same blotted membrane. Representative immunoreactive bands are shown. Data represent the means ± SEM (percentage treated vs control) of six separate experiments run in triplicate. *p < 0.05, **p < 0.01 versus the respective control value (two-tailed Student's t test).

