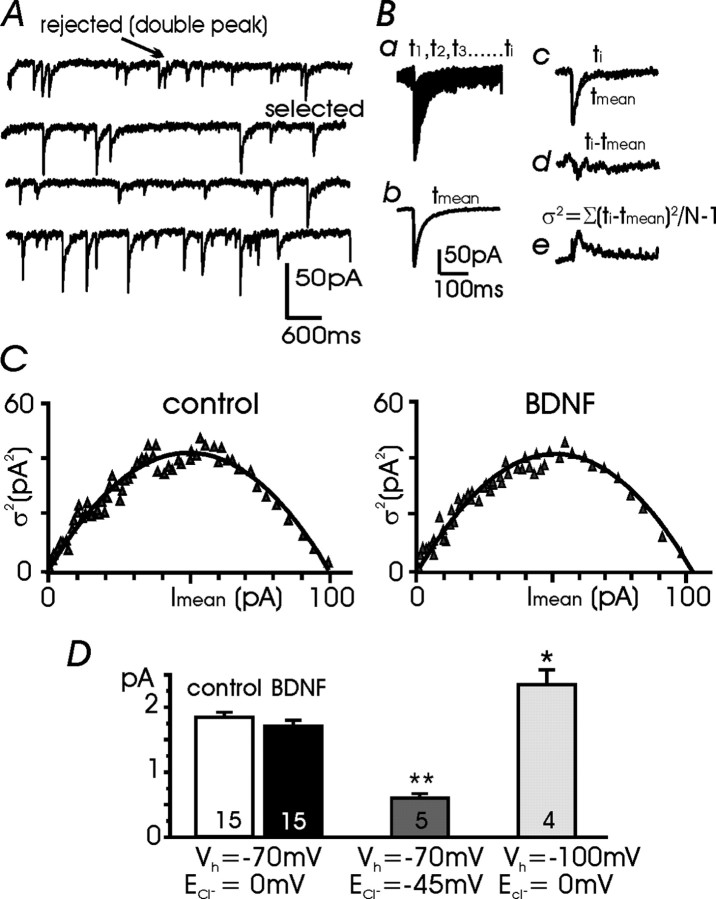
Figure 2.
PSVA of mIPSCs. A, Consecutive miniature recordings used to select events without double peaks or anomalous noise. B, a, Eighty superimposed mIPSCs, selected as shown in A; b, mean waveform of selected events; c, an mIPSC superimposed to the scaled mean waveform; d, difference between the scaled mean waveform and the individual mIPSC; e, σ2(t) calculated by summing the squares of the difference traces divided by N - 1. C, Relationship between mean current and peak-scaled variance obtained from a representative control and BDNF-treated neuron. D, Mean unitary currents in control neurons and BDNF-treated neurons (n = 15) at Vh = -100 mV (n = 4) and at [Cl-]i = 25 mm (n = 5) (**p < 0.01 and *p < 0.05 vs controls). ECl- indicates the Nernst equilibrium potential for Cl- ions.

