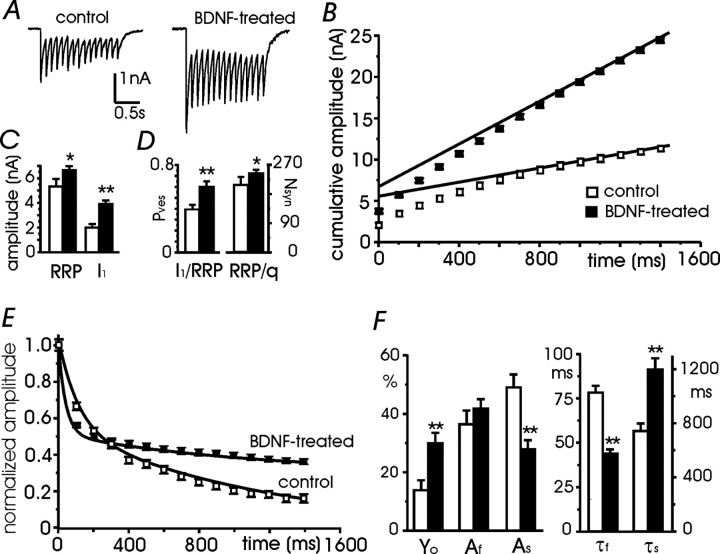
Figure 4.
Estimate of the RRPsyn and Pves through cumulative amplitude analysis. A, eIPSCs recorded during a train of repetitive stimuli of 10 Hz in a control (left) and a BDNF-treated (right) neuron. B, Cumulative eIPSC amplitude during 10 Hz trains in eight control and eight treated neurons. Data points in the range of 0.8-1.4 s were fitted by linear regression and back-extrapolated to time 0 to estimate the cumulative eIPSC amplitudes before steady-state depression (RRPsyn). C, The mean amplitude of the first eIPSC (I1) is nearly doubled in treated neurons (filled bars; n = 8) versus control neurons (open bars; n = 8) (**p < 0.01 vs controls), whereas the mean RRPsyn is only slightly increased (*p < 0.05 vs controls). D, Mean Pves (**p < 0.01 vs controls) and mean number of vesicles forming the RRPsyn (*p < 0.05 vs controls). E, Plot of eIPSC amplitude versus time during repetitive stimulation fitted with a double-exponential function: I(t) = yo + Af e(-t/τf) + As e(-t/τs). F, Mean values of the parameters obtained by the double-exponential fit of E (n = 8; ** p < 0.01 vs controls).

