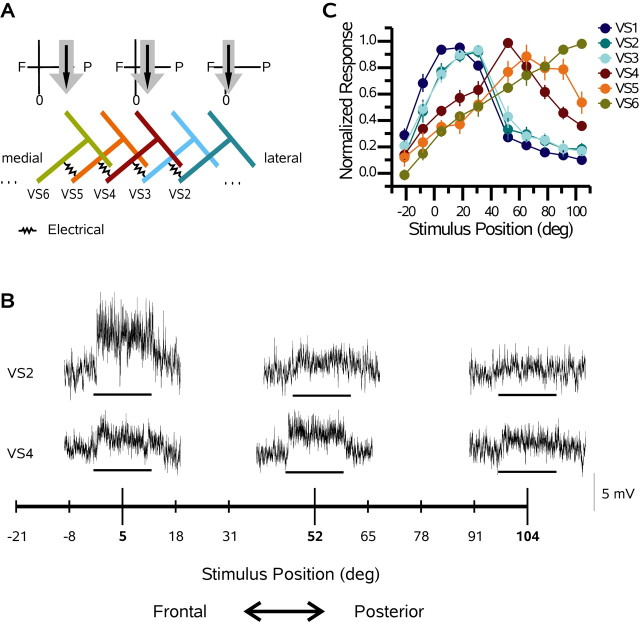
Figure 1.
VS cell network and receptive fields. A, Schematic network of VS cells. Above the VS6, VS4, and VS2 cells is a diagram of the receptive field of each cell (gray and black arrows). The black arrows indicate the central receptive field of each cell, whereas the gray arrows show its spatial extent. As one moves laterally in the lobula plate, the receptive fields move frontally in visual space. B, Single responses of a VS2 and VS4 cell recorded from the same flys how the basic response properties of VS cells. Note that both cells respond to downward motion with a graded shift in membrane potential. The response amplitude depends on the stimulus position (see arrows). For each trace, the stimulus was applied for 1 s. The scale bar is relevant for each trace. C, Responses of six VS cells to downward motion as a function of stimulus position. Zero degrees on the x-axis represents the position directly in front of the fly, and positive numbers represent positions on the same side on which the cells were recorded. Each data point is the mean response ± SEM, normalized with respect to its maximum. Note the strong overlap of VS1 (n = 12), VS2 (n = 7), and VS3 (n = 9) cells. In addition, the responses of the VS4 (n = 13), VS5 (n = 5), and VS6 (n = 6) cells shift posteriorly. deg, Degrees.

