
Figure 3.
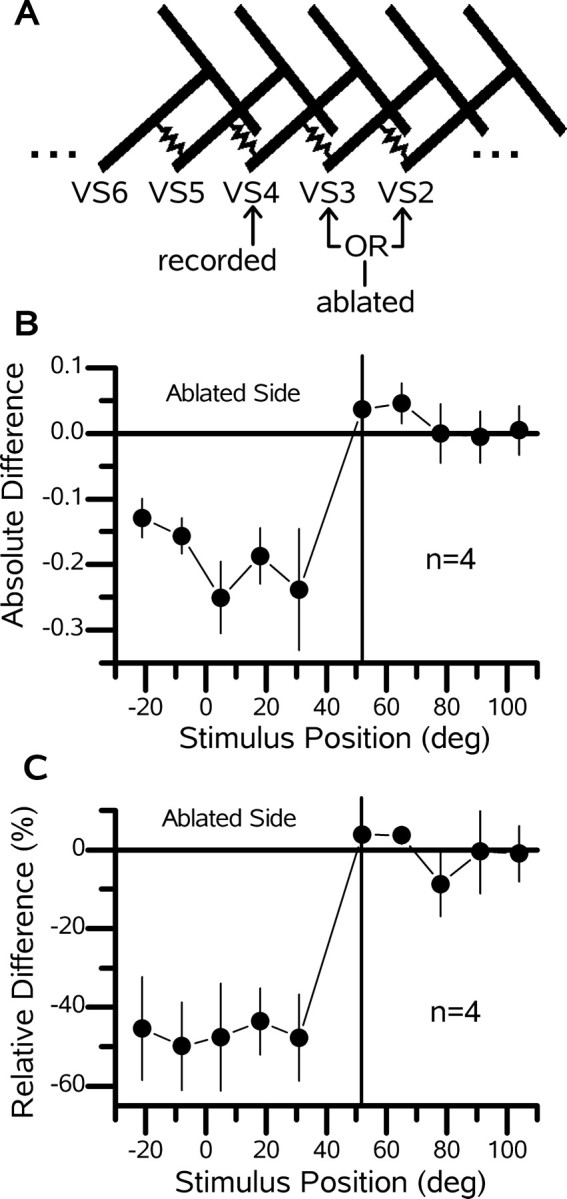
Deficit of a VS4 cell after the ablation of frontal viewing VS cells. A, Schematic of the VS cell network showing the relationship between the recorded cell (VS4) and the ablated cells (VS2 or VS3). B, Mean difference ± SEM of the receptive fields (postresponse minus preresponse) for a group of four VS4 cells in which either a VS2 (n = 1) or a VS3 (n = 3) cell was ablated. C, Relative difference [(post - pre)/pre × 100; in percentage] for the data shown in B. Note that, at each stimulus location frontal to the peak response of the VS4 cell, the response drops by approximately the same amount (∼50%). deg, Degrees.