
Figure 5.
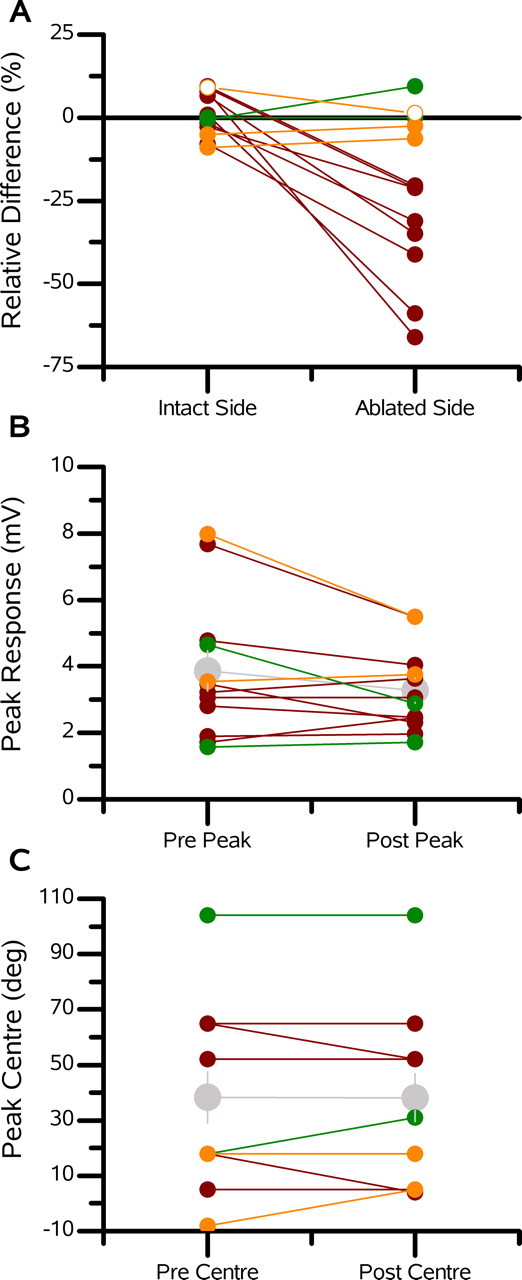
Summary of ablations. A, Mean relative difference between the postablation and preablation responses shown for both the ablated side and intact side of the receptive fields of the recorded VS cells. The ablated side consists of those stimulus positions at and beyond, from the point of view of the recorded cell, the peak of the ablated cell. The intact side comprises all other stimulus positions. In each graph, the red data points represent the neighbor ablations, the green data points represent the distant ablations, and the orange data points represent VS1 cell ablations while recording one of the medial VS cells. B, Peak responses for each experiment before and after the ablation of a single VS cell. The gray data points represent the mean ± SEM of all experiments. C, Peak response position for each cell before and after the ablation of another VS cell. The gray data points represent the mean ± SEM. deg, Degrees.