
Figure 6.
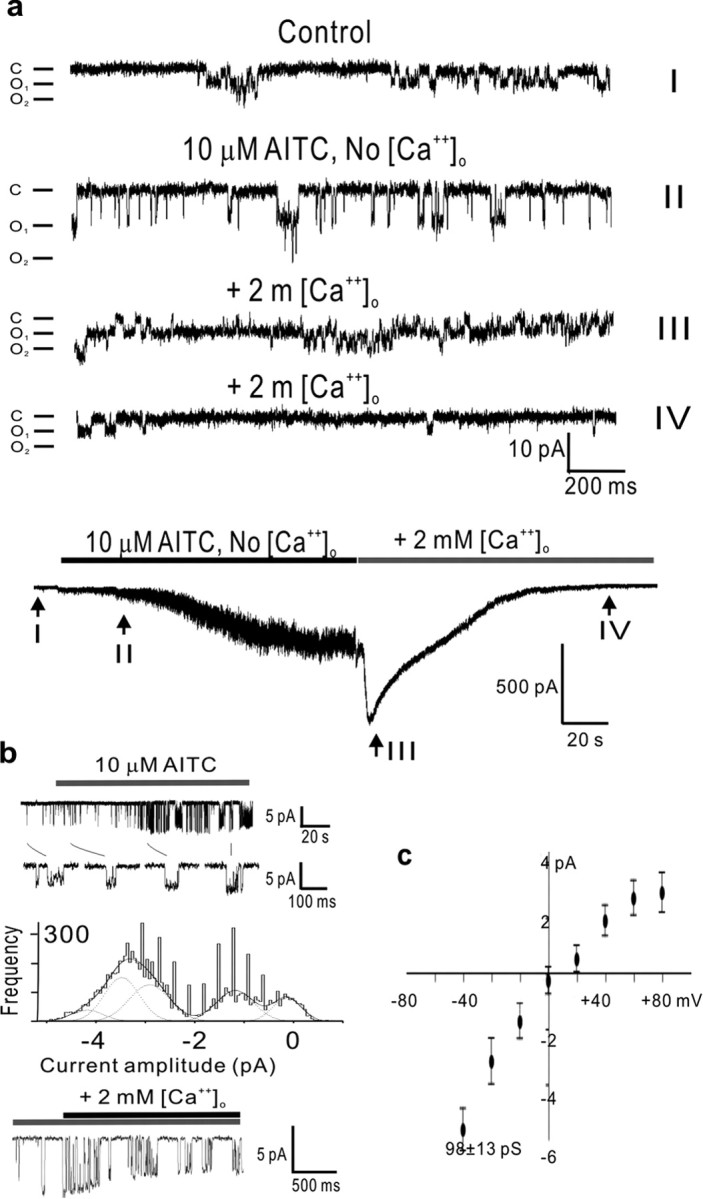
Single-channel properties of TRPA1. a, Recapitulation of TRPA1 slow activation, calcium-induced potentiation, and subsequent inactivation at the single-channel level in outside- out patches (at a holding potential of -80 mV). AITC, in the absence of calcium, activates a large conductance, flickery channel (II, activation) that, on exposure to calcium, transitions to a low conductance but high open-probability state (III, potentiation) followed by a low open-probability state (IV, inactivation). The bottom trace is a whole-cell record, obtained just before patch formation, indicating (in roman numerals) the times that correspond to the single-channel traces above. b, Transitions between low and high single-channel currents reveal a multitude of intermediate conductance levels for TRPA1 channels. Top trace, Cell-attached patch (with standard external solution in the pipette; amplitudes of 3.4, 4.1, 4.6, and 4.9 pA). Middle trace, Amplitude histograms of currents induced by application of AITC. Curves super-imposed on the histograms are five Gaussian fits to the data points. At least four conductance levels were discerned. Bottom trace, Outside- out patch at a holding potential of -80 mV (amplitudes ranging continuously from 6.4 to 3.3 pA). c, Current-voltage relationship of a representative TRPA1 channel, with a conductance of 98 pS at -60 mV, activated with 10 μm AITC and recorded on a cell-attached patch with standard external solution in the pipette. For all panels, the trace shown is a representative of at least four separate membrane patches. Error bars in c represent confidence interval. C, Channels closed; O1, one channel open; O2, two channels open.