
Figure 2.
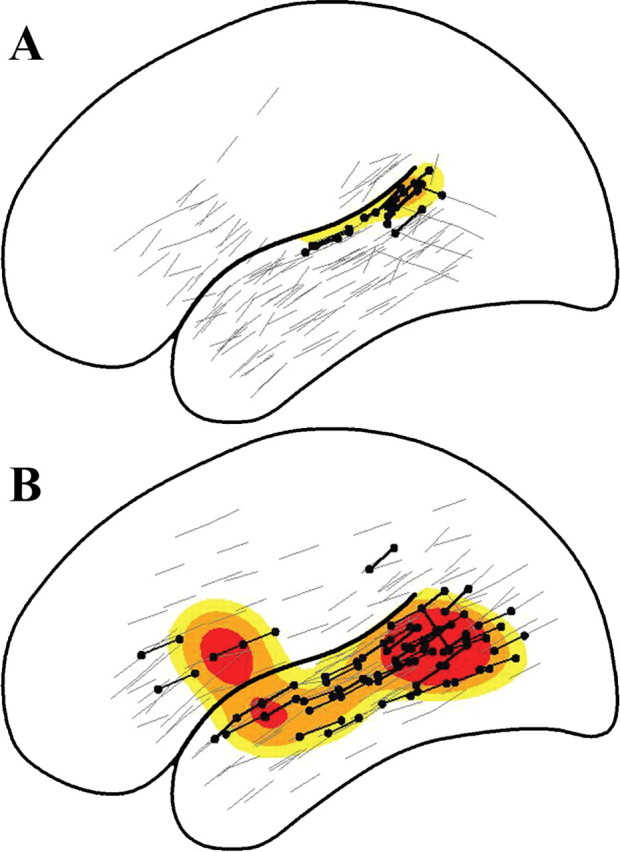
Population probability densities for the distribution of auditory speech discrimination deficits in normal listeners (A) and impaired listeners (B). Black dots represent sites where auditory speech discrimination was impaired; gray lines identify sites where speech discrimination was intact. Yellow contours, 0.05 ≤ p < 0.10; orange contours, 0.10 ≤ p < 0.20; red contours, p > 0.20, where p is the probability that a site is associated with a deficit.