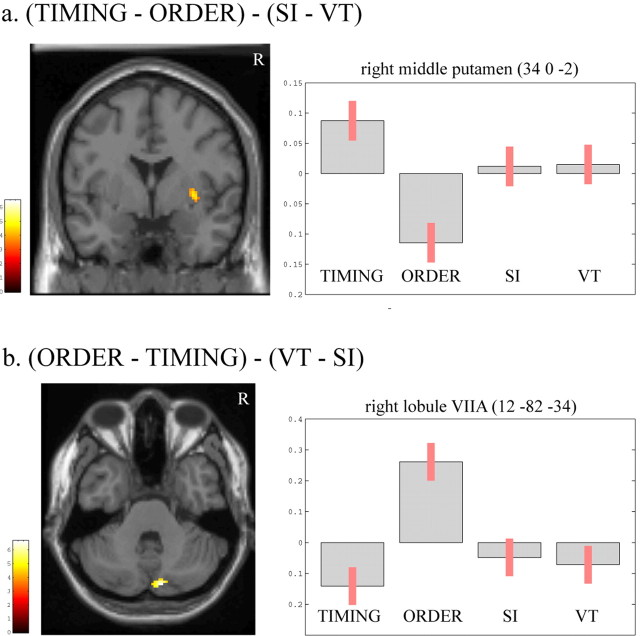
Figure 4.
Areas of the brain showing differential activity when [TIMING] and [ORDER] were compared using the two-by-two factorial design (Fig. 2). Activity in right putamen was stronger during [TIMING] than [ORDER] (a), whereas activity in right posterior cerebellar lobule VIIA was stronger during [ORDER] than [TIMING] (b). Results are displayed at p < 0.001, uncorrected, masked by the SPM{t} of the appropriate contrast between [TIMING] and [ORDER] ([TIMING - ORDER] or [ORDER - TIMING]), at p < 0.0001, uncorrected. The pseudocolor scales correspond to T values from the random effect analyses. Parameter estimates (90% confidence interval) showing mean ± SE activation during each experimental condition clearly demonstrates that the differential activity in these subcortical areas was not dependent on differences in the mode of movement initiation between conditions. R, Right.

