
Figure 3.
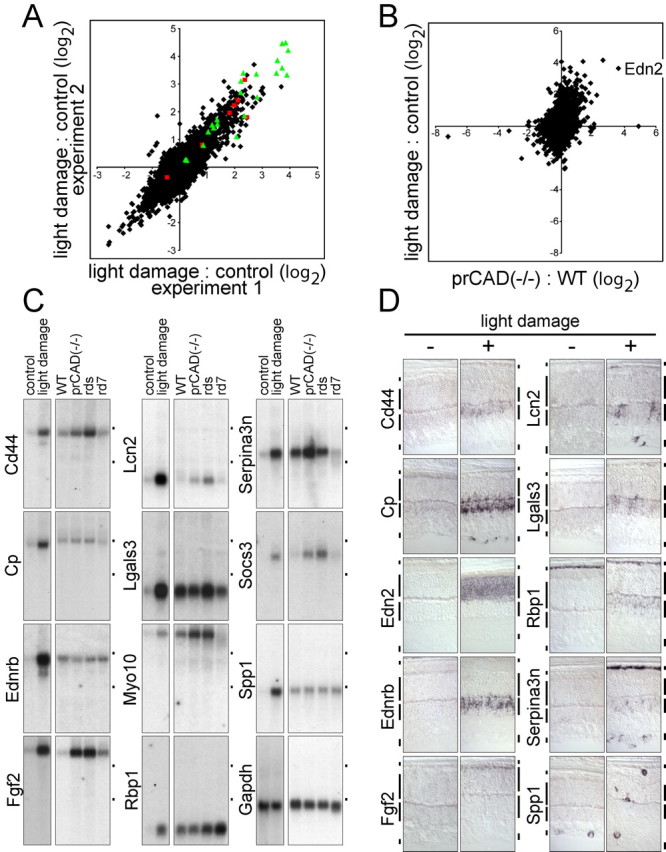
Changes in transcript levels in response to light damage. A, Scatter plot comparing the ratio of light-damaged/control retina RNA hybridization signals in two independent microarray experiments. Hybridizations were performed with the Affymetrix mouse genome MOE430 chip, and the ratios are plotted on a log2 scale. On the MOE430 chip, some of the transcripts are represented by groups of oligonucleotide hybridization targets that are listed as separate entries in compilations of transcript abundances. As an extreme example, ceruloplasmin transcripts are represented by seven different entries; these are indicated by red squares in the scatter plot. Green triangles indicate the 12 transcripts tested by RNA blotting and in situ hybridization (including Edn2 and Ednrb). For the light-damage samples, dark-adapted BALB/c mice were dilated, light exposed for 6 h, and then placed in darkness for 24 h. Control BALB/c mice were dark adapted. B, Scatter plot comparing the averaged prCAD-/-/WT microarray hybridization signals (Fig. 1A) to the averaged light-damaged/control microarray hybridization signals (A). The point representing Edn2 hybridization is labeled. C, RNA blot hybridization validates the transcript inductions predicted by microarray hybridization for 11 of 11 transcripts tested and shows different relative levels of induction in light-damaged and genetically based retinopathies. The WT control mice used for comparison with the genetic retinopathies was 129 maintained in a standard 12 h light/dark cycle. Fgf2 represents an example in which microarray hybridization significantly under estimates the fold induction: little or no induction was predicted by microarray hybridization with prCAD-/- versus WT retina RNA, but RNA blotting shows an ∼10-fold induction (supplemental Table 3, available at www.jneurosci.org as supplemental material). Cp, Ceruloplasmin; Lcn2, lipocalin2; Lgals3, soluble galactose binding lectin 3; Myo10, myosin X; Rbp1, retinoid binding protein 1; Socs3, suppressor of cytokine signaling 3; Spp1, secreted phosphoprotein 1/osteopontin. Dots to the right of each blot indicate the locations of the 28 and 18S ribosomal RNAs. D, Cellular localization of transcripts induced by light damage as determined by in situ hybridization. Vertical bars adjacent to each retinal section demarcate (from top to bottom) RPE, the outer nuclear layer ONL, INL, and GCL.