
Figure 4.
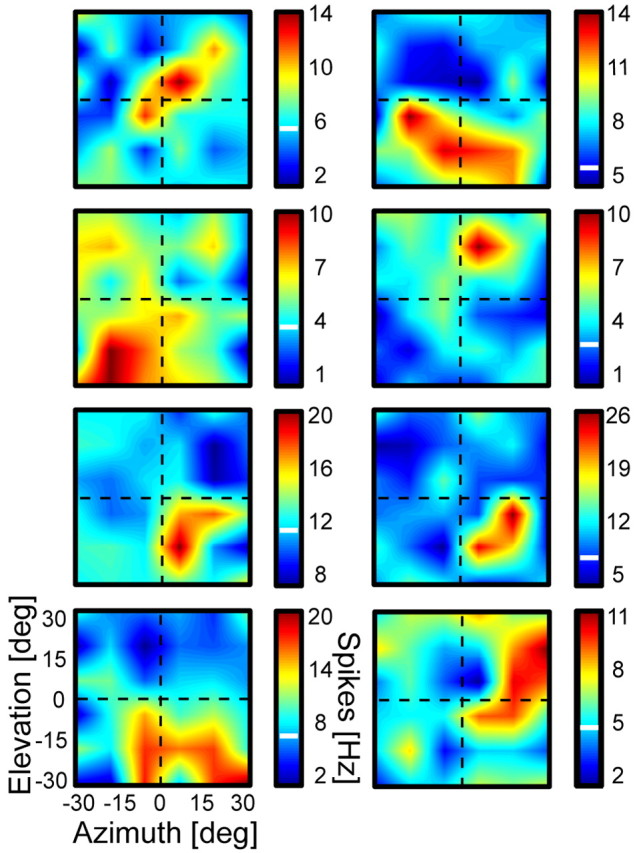
Auditory receptive field examples. Same convention as for the middle panel of Figure 3. The figure shows a variety of auditory receptive fields with different shapes, positions, and sizes. Each panel thereby corresponds to the auditory RF plot of one area VIP neuron. deg, Degrees.