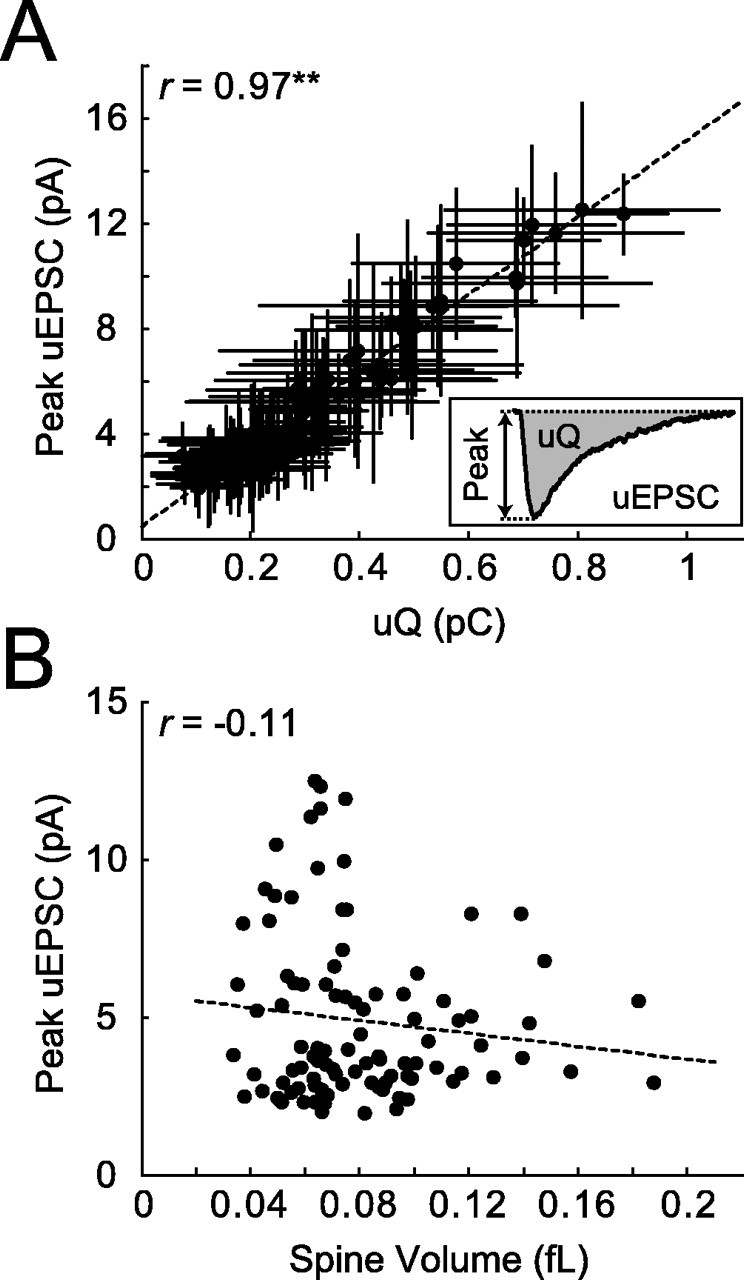
Figure 2.

NMDA-R-mediated uEPSCs. A, uEPSC peak amplitude and charge are highly correlated (r = 0.97; **p < 0.001; 98 spines; 12 cells). Error bars represent SD. B, uEPSC amplitudes are independent of spine volume, implying that smaller spines have higher NMDA-R densities (r = -0.11; same dataset as in A).
