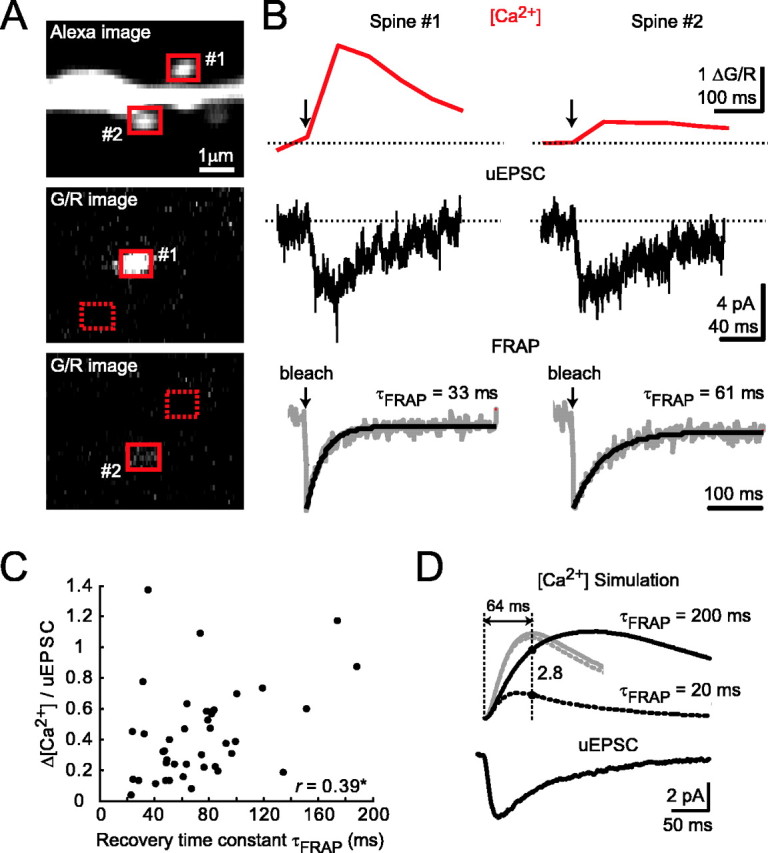
Figure 5.

Effects of diffusional coupling across the spine neck on [Ca2+] signals. A, Example of two spines with different Δ[Ca2+] (1 and 2). An Alexa image of the two spines (top) and G/R images after stimulation of spine 1 (middle) or spine 2 (bottom) are shown. B, Δ[Ca2+] (top) and uEPSC (middle) for spines 1 and 2. FRAP measurements (bottom) for these spines indicate that diffusional coupling is unlikely to explain the observed differences in Δ[Ca2+]. C, Δ[Ca2+]/uEPSC as a function of τFRAP (r = 0.39; *p < 0.05; 41 spines; 6 cells). D, Numerical simulations of [Ca2+] dynamics. Top, Simulated [Ca2+] transients (arbitrary units; black traces, 1 mm Fluo-5F; gray traces, no added buffer, scaled down in amplitude by a factor of 15) using the NMDA-R uEPSC (bottom) as an input. Δ[Ca2+] time courses for extreme values of τFRAP are shown (200 ms, solid line; 20 ms, dotted line).
