
Figure 4.
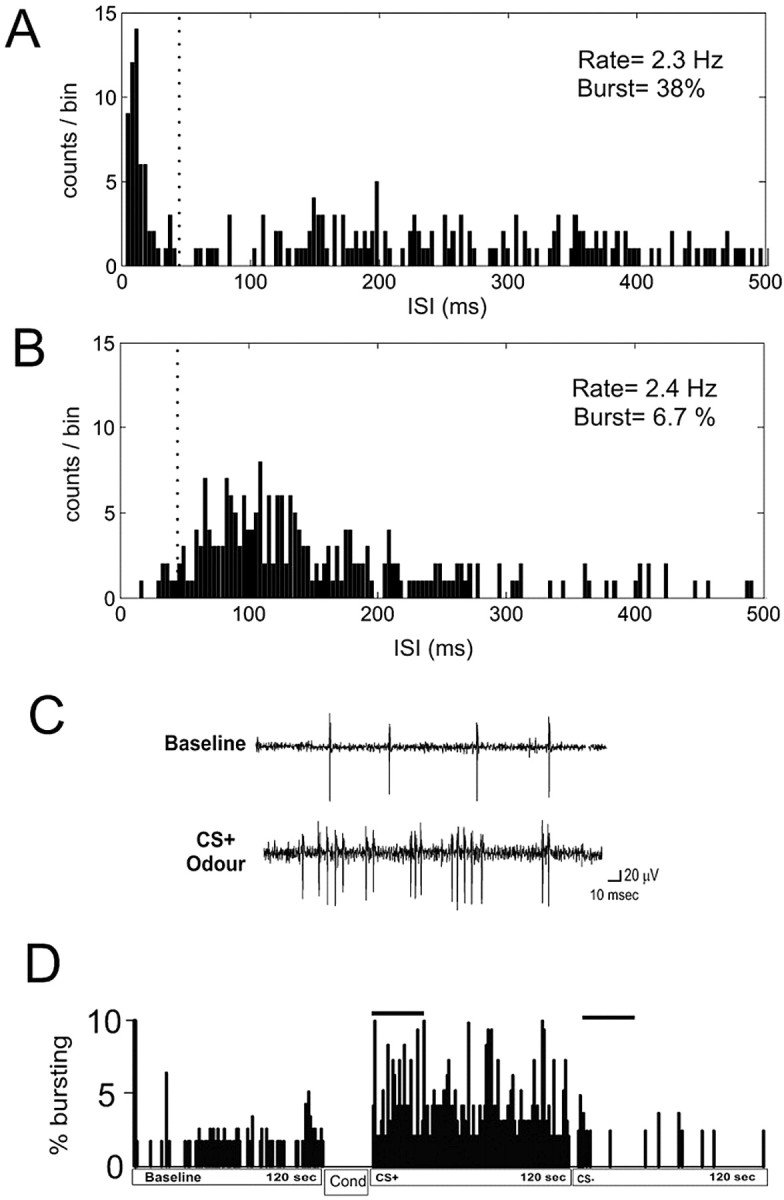
Degree of burst firing was independent of firing frequency in mPFC neurons. A and B show ISI histograms obtained from representative PFC neurons exhibiting marked differences in firing pattern despite firing at a similar frequency. A, An example of a neuron showing a high degree of bursting (37%), as can be observed from the peak in the ISI histogram at short ISIs. B, An example of a neuron showing primarily an irregular pattern of spike discharge with few burst events, as evidenced by the more symmetrical ISI distribution and a low degree of bursting (6.7%). The dotted line marks the cutoff for burst ISIs (45 ms). C, Neuronal activity traces from a single mPFC, BLA-responsive neuron recorded during the first 5 s of preconditioning baseline activity and the first 5 s of CS+ odor presentation after conditioning illustrate typical baseline, nonbursting activity responding pattern versus postconditioning bursting response to the CS+ odor presentation. This neuron demonstrated no bursting activity in response to the CS- presentation. D, Percentage of spiking events occurring in bursts for a single, BLA-responsive mPFC neuron comparing the baseline bursting level relative to the postconditioning responses to the presentation of the CS+ odor versus the CS- odor. Typically, BLA-responsive neurons showed a dramatic increase in bursting specifically in response to the CS+ versus the CS- odor relative to baseline. Cond, Conditioning.