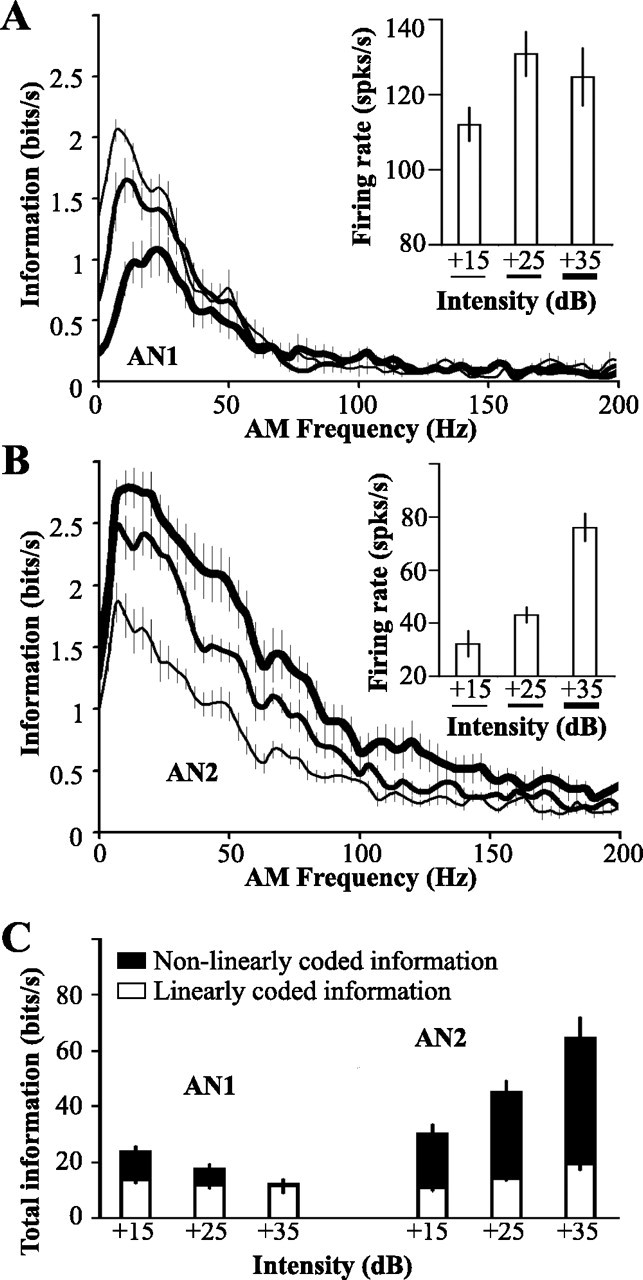
Figure 1.

Temporal coding by AN1 and AN2. RAM stimuli were presented with mean intensities 15, 25, or 35 dB above threshold, with CF of 4.5 kHz for AN1 and 30 kHz for AN2. Mean ± SD threshold of AN1, 46.1 ± 4.2 dB SPL; threshold of AN2, 53.2 ± 5.1 dB SPL. A, Mean ± SE information transfer rate of AN1, n = 7; inset shows mean firing rate as a function of stimulus intensity. B, Mean ± SE information transfer rates of AN2, n = 8; inset as in A. C, Mean ± SE total information content of AN1 and AN2 spike trains (areas under the curves in A and B). Open portions of bars show information content accounted for by a linear model of coding; filled portions represent the degree of nonlinear coding (see Materials and Methods). Total information was calculated by summing information rates only for those AM frequencies at which information rate differed significantly from zero, as assessed by jackknife resampling (Efron and Tibshirani, 1993).
