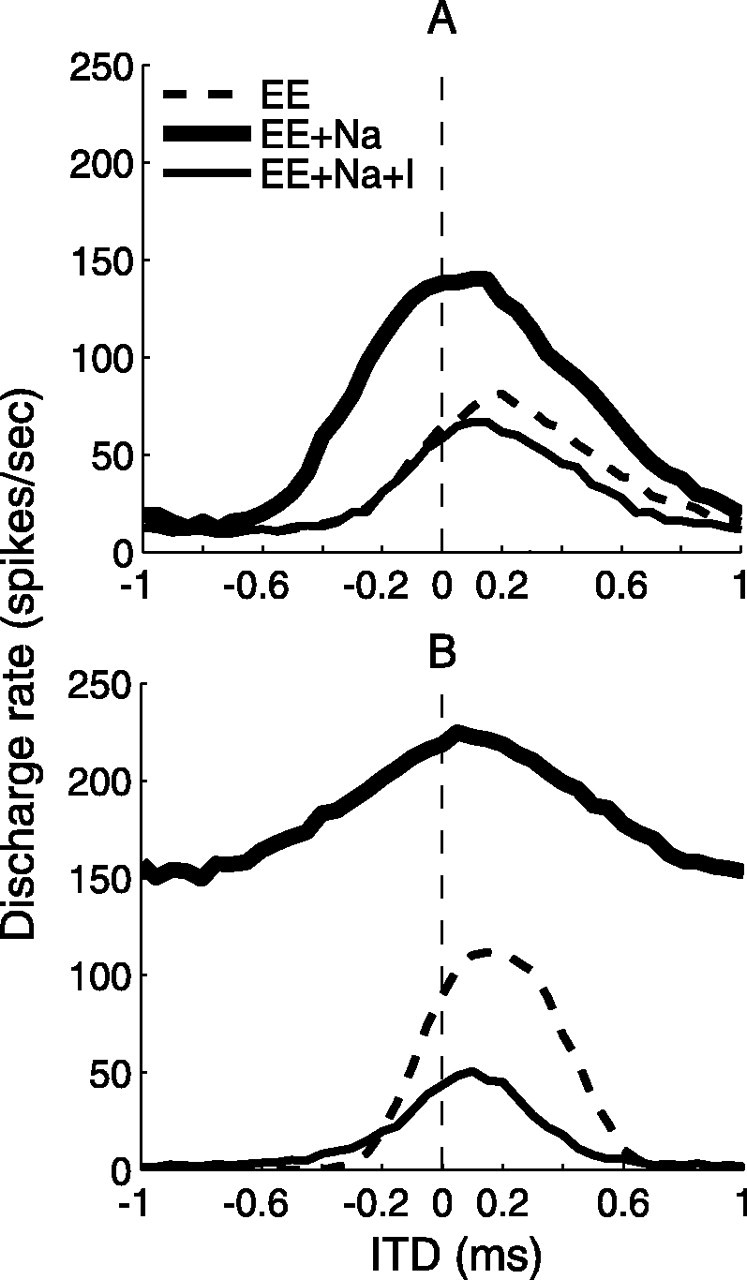
Figure 11.

The effect of excitation level on the shift of the peak ITD. A, Overall response rates were reduced when the strength of excitation was decreased (Ge = 9 nS) compared with that in Figure 6 for 500 Hz inputs, but activations of sodium currents (GNa = 0.1 S/cm2) and inhibition (Gi = 6 nS) still shifted the peak ITD. B, The disparity in bilateral levels of excitation (Ge = 30 nS for the contralateral, Ge = 6 nS for the ipsilateral) did not affect the peak ITD in the EE condition. Here, Gi = 15 nS and GNa on the soma was 0.07 S/cm2. Other input parameter values are listed in Table 2 (for 500 Hz).
