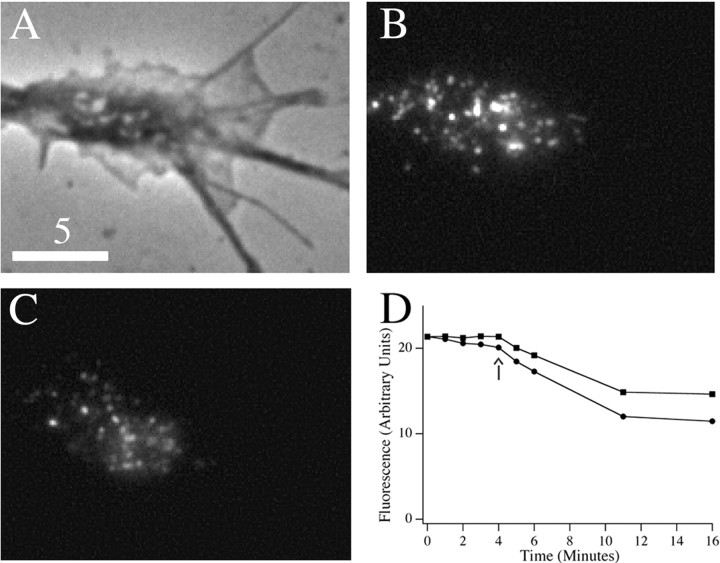
Figure 2.
Phase (A) and wide-field fluorescence (B, C) images of a growth cone before (B) and 7 min after (C) stimulation with high KCl are shown. D, Temporal dependence of the fluorescence signal from the growth cone before and after stimulation, which occurs at the time point indicated by the arrow. Circles show raw data, and squares show data corrected for photobleaching. Scale bar, 5 μm.

