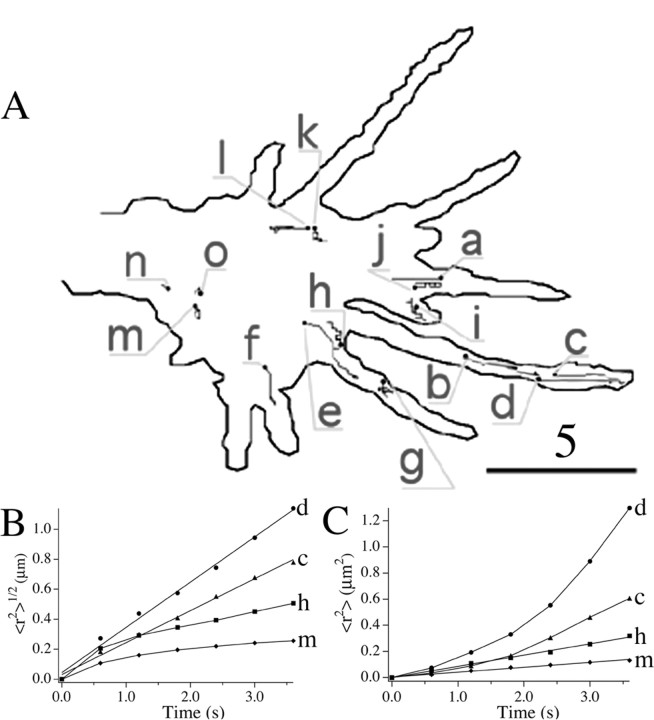
Figure 5.
A, Trajectories of DCGs in the growth cone in Figure 4, superimposed on an outline of the growth cone. The starting DCG positions are labeled with a filled circle. Not all of the trajectories shown were generated simultaneously, and a few trajectories corresponding to different times were displaced slightly to avoid overlap. Scale bar, 5 μm. Representative plots of 〈r2〉1/2 versus t (B) and 〈r2〉 versus t (C) deduced from the DCG trajectories in A are shown. The letters next to the plots identify the trajectories from which the plots were derived. Some values were rescaled so that all plots could be displayed together conveniently. In B, values of 〈r2〉1/2 were multiplied by 2 for DCG h. In C, values of 〈r2〉 were multiplied by 5 and 2 for DCGs h and m, respectively.

