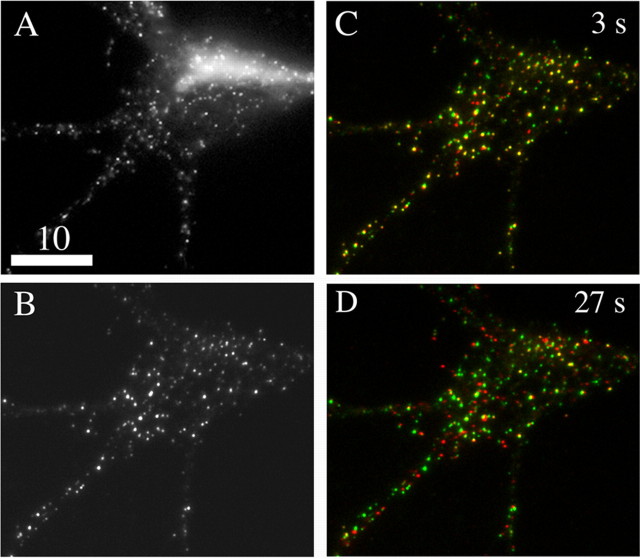
Figure 6.
Comparison wide-field (A) and TIRFM (B) images of the soma and proximal processes of a hippocampal neuron expressing tPA-EGFP are shown. Fluorescence from deeper in the cell (e.g., from the trans-Golgi network) is visible only in the wide-field image. C, D, TIRFM images, analogous to those in Figure 4, showing that the distribution of membrane-proximal DCGs containing tPA-EGFP changes appreciably over the time scale of 27 s. Scale bar, 10 μm.

