
Figure 7.
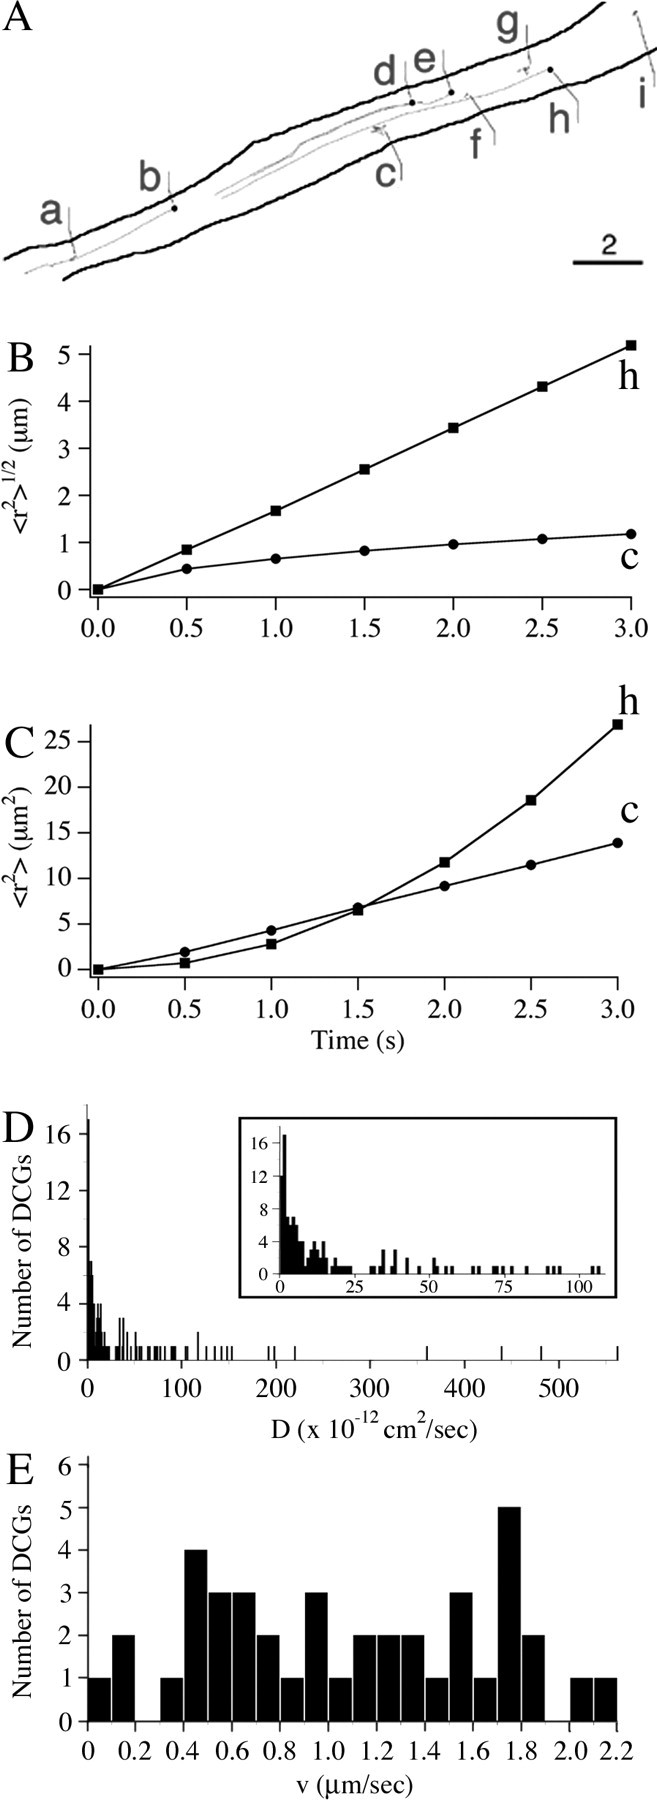
A, Trajectories of membrane-proximal DCGs in a process, superimposed on an outline of the process. The starting DCG positions are labeled with a filled circle. Not all of the trajectories shown were generated simultaneously. Scale bar, 2 μm. B, C, Representative plots, analogous to those in Figure 5, deduced from the DCG trajectories in A. Values of 〈r2〉1/2 and 〈r2〉 were multiplied by 10 and 1000 for DCG c. D, E, Histograms showing the distribution of diffusion coefficients and speeds obtained in TIRFM experiments. The inset in the diffusion histogram shows just the range covered by the PC12 cell diffusion histogram to facilitate comparison of these histograms over their domain of overlap (Ng et al., 2003).