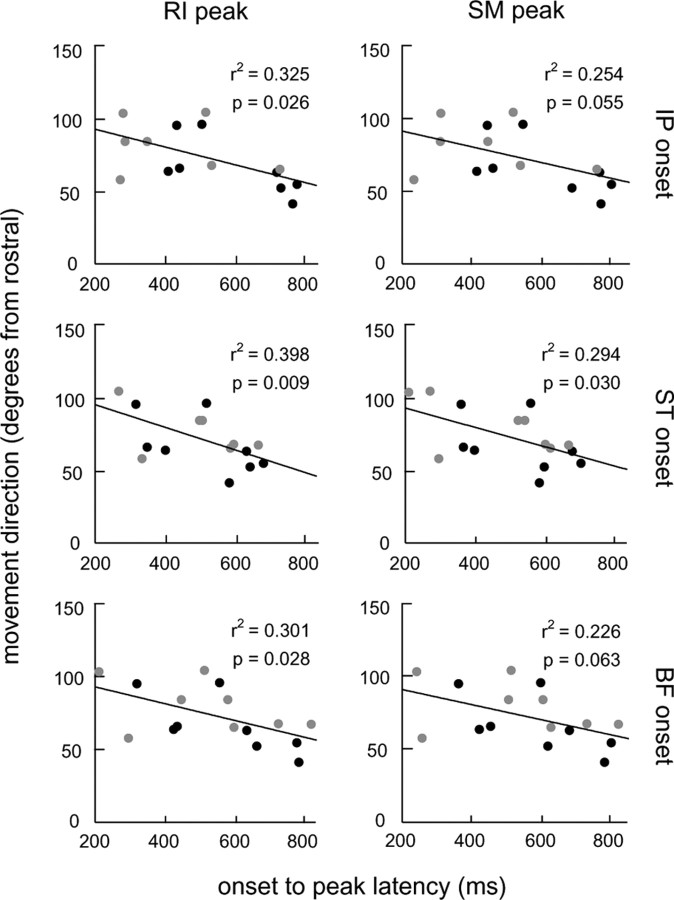
Figure 3.
Correlation of the average initial movement direction with the average latency between onset of limb flexion muscle activity (IP, ST, BF) and peak hip extension muscle activity (RI, SM). For each plot, the latency refers to the time between onset of the limb flexor muscle indicated to the right of the row and peak of the hip extensor muscle indicated at the top of the column. The linear least-squares fit to the data is indicated on each plot along with the r2 statistic and p value for the regression. Data from afferent-intact frogs are indicated by black circles, whereas those of frogs with a deafferented wiping limb are indicated by gray circles.

