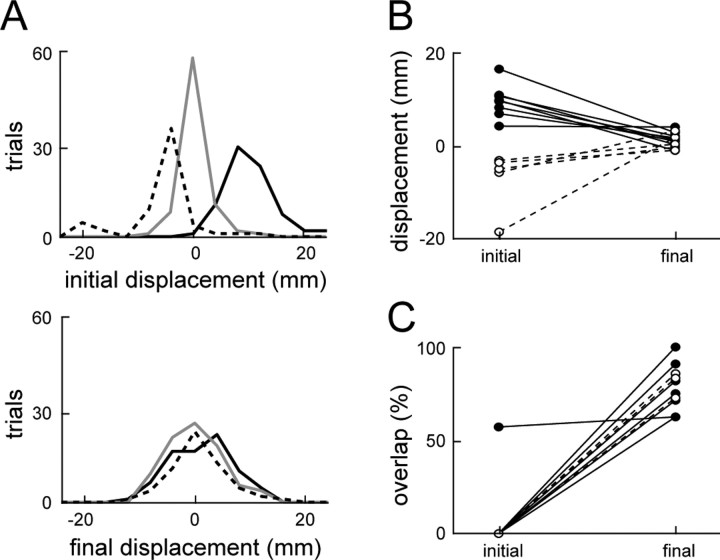
Figure 6.
Stability summary for all of the afferent-intact frogs. A, The summed initial (top) and final (bottom) displacement distributions of all eight afferent-intact frogs. The solid black line, solid gray line, and dashed black line indicate the displacement distribution for counterclockwise perturbation trials, unperturbed trials, and clockwise perturbation trials, respectively. B, The mean initial and final displacements for each afferent-intact frog. C, The percentage overlap of the middle 95% of the perturbed and unperturbed final displacement distributions for each afferent-intact frog. In B and C, mean displacements and percentage overlaps, respectively, are shown for counter clockwise perturbations (solid lines and black circles) and clockwise perturbations (dashed lines and white circles).

